See also


 31.10.2023 12:12 PM
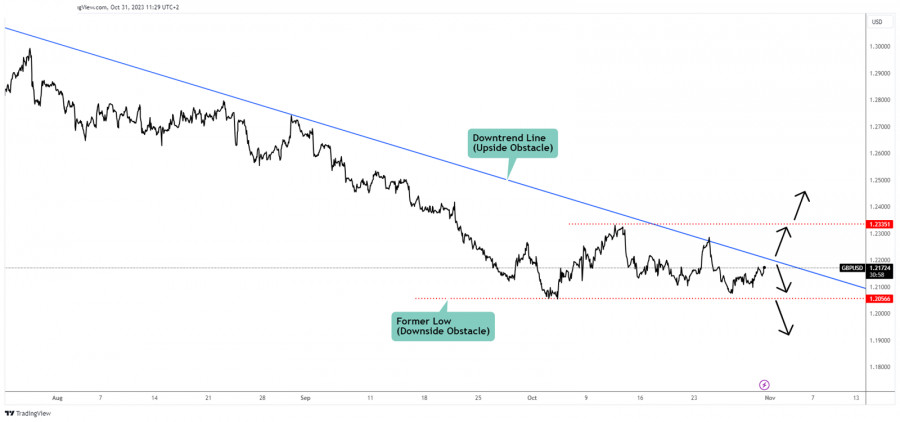
The GBP/USD pair is trading somehow sideways in the short term and it seems undecided. It's located at 1.2181 at the time of writing. As you can see on the h1 chart, the rate dropped as much as 1.2056 where it has found strong demand.
Technically, the downtrend line represents an upside obstacle. So, as long as it stays below it, the rate could drop towards new lows. Only jumping and stabilizing above this upside obstacle invalidated a downside continuation.
Staying below the downtrend line and dropping under 1.2056 activates more declines.
Jumping and the downtrend line and passive beyond the former high of 1.2335 validate a larger growth.
You have already liked this post today
*The market analysis posted here is meant to increase your awareness, but not to give instructions to make a trade.
If Bitcoin fails to break above 103,700, a further technical correction is expected. So, the price could reach the psychological level of $100,000 and even reach the bottom
Early in the American session, gold is trading around 3,195, below the 5/8 Murray line and below the 200 EMA and the 21 SMA, with a strong bullish bias. During
Useful links: My other articles are available in this section InstaForex course for beginners Popular Analytics Open trading account Important: The begginers in forex trading need to be very careful
From what is seen on the daily chart, the Exotic USD/IDR currency pair appears to have a Bearish 123 pattern followed by the appearance of 2 Bearish Ross Hook (RH)
Your IP address shows that you are currently located in the USA. If you are a resident of the United States, you are prohibited from using the services of InstaFintech Group including online trading, online transfers, deposit/withdrawal of funds, etc.
If you think you are seeing this message by mistake and your location is not the US, kindly proceed to the website. Otherwise, you must leave the website in order to comply with government restrictions.
Why does your IP address show your location as the USA?
Please confirm whether you are a US resident or not by clicking the relevant button below. If you choose the wrong option, being a US resident, you will not be able to open an account with InstaTrade anyway.
We are sorry for any inconvenience caused by this message.

