See also


 20.10.2023 05:37 PM
The USD/CHF pair is moving sideways in the short term, trying to accumulate more bearish energy before extending its sell-off. The bias remains bearish, so more declines are natural. Unfortunately, the Dollar Index is trading in the red in the short term. A deeper drop should weaken the USD.
The greenback is bearish after Canadian Retail Sales reported a 0.1% drop as expected, while Core Retail Sales increased by 0.1% even if the specialists expected a 0.1% drop. The USD dropped as the figures came in worse compared to the previous reporting period.
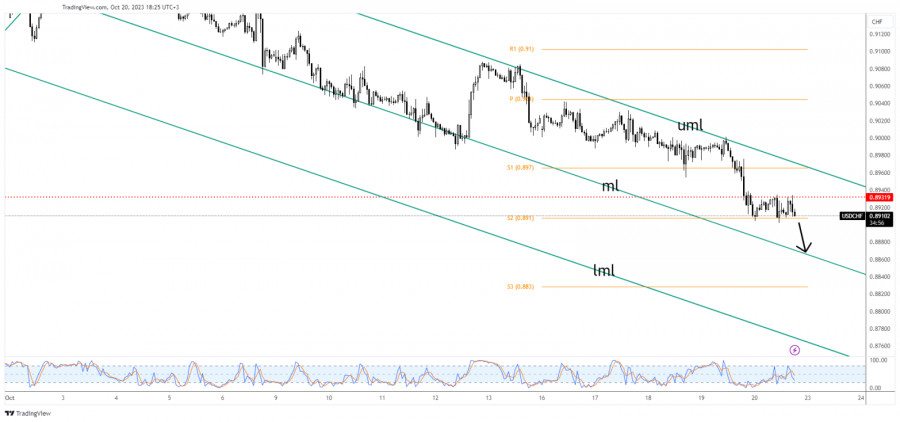
Technically, the rate registered a major decline between the median line (ml) and the upper median line (uml).
Now, it has taken out the historical level of 0.8931 but it has found support on the weekly S2 (0.8910).
Dropping and closing below the S2 (0.8910) activates more declines. This is seen as a bearish signal. The median line (ml) is seen as the first downside target.
You have already liked this post today
*The market analysis posted here is meant to increase your awareness, but not to give instructions to make a trade.
Early in the American session, the EUR/USD pair is trading around 1.1358 within the downtrend channel formed on April 18. The pair is under bearish pressure. We believe the instrument
Useful links: My other articles are available in this section InstaForex course for beginners Popular Analytics Open trading account Important: The begginers in forex trading need to be very careful
On the 4-hour chart, the Silver commodity instrument is visible even though its condition is strengthening where this is confirmed by the movement of the Silver price which is moving
Our trading plan for the next few hours is to sell gold below $3,333, with targets at $3,313 and $3,291. We can buy above $3,280 with short-term targets at $3,437
With the appearance of Divergence between the price movement of the AUD/JPY cross currency pair with the Stochastic Oscillator indicator and the price movement of AUD/JPY which is above
If we look at the 4-hour chart, the Gold commodity instrument appears to still be moving in a Bullish bias, but with the appearance of Divergence between the Gold price
Useful links: My other articles are available in this section InstaForex course for beginners Popular Analytics Open trading account Important: The begginers in forex trading need to be very careful
If we look at the 4-hour chart of the GBP/CHF cross currency pair, there are several interesting facts. First, the appearance of a Triangle pattern followed by the movement
InstaTrade
PAMM accounts

Your IP address shows that you are currently located in the USA. If you are a resident of the United States, you are prohibited from using the services of InstaFintech Group including online trading, online transfers, deposit/withdrawal of funds, etc.
If you think you are seeing this message by mistake and your location is not the US, kindly proceed to the website. Otherwise, you must leave the website in order to comply with government restrictions.
Why does your IP address show your location as the USA?
Please confirm whether you are a US resident or not by clicking the relevant button below. If you choose the wrong option, being a US resident, you will not be able to open an account with InstaTrade anyway.
We are sorry for any inconvenience caused by this message.

