See also


 31.10.2022 11:20 AM
BITCOIN
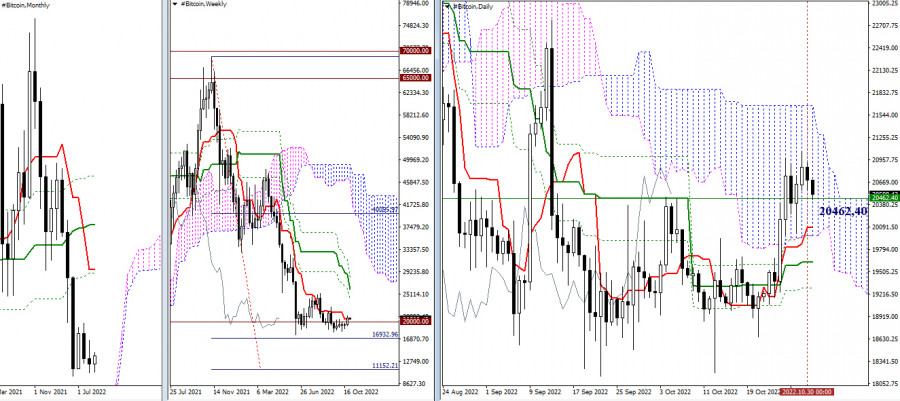
Following a bull run to 65,000, BTC failed to reach 70,000 and went deep down. Amid the increased bearish activity, a reversal took place. Ichimoku crosses saw changes in the weekly and monthly time frames. In addition, the weekly Cloud was broken and a bearish target formed. The targets at 16933 and 11152 are now seen as important barriers for the downtrend to extend. However, bitcoin is currently consolidating around the psychological support level of 20,000. Should the bears push the price further down, the bulls consolidate above the weekly short-term trend (20,462.40) and BTC leave the daily Cloud and enter a bullish zone, the target would stand at 24,043.77. The price would hit the target in case of a breakout through the daily Ichimoku Cloud and the resistance of the weekly Cross.
H4-H1
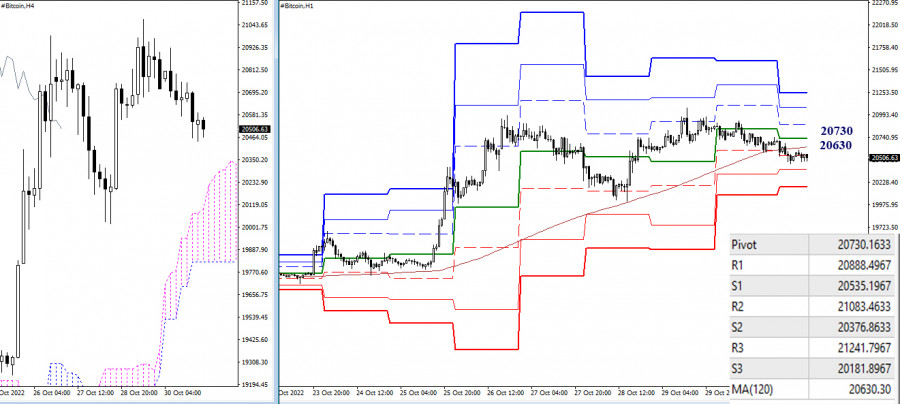
In the lower time frames, the downtrend is getting deeper. The bears are now active below the key levels of 20,630 – 20,730 (weekly long-term trend + central Pivot level). The downtrend would extend should bearish sentiment increase. The nearest intraday support levels are seen at 20,376.86 and 20,181.90 (classic Pivot levels). If BTC returns to the key levels of the lower time frames (20,630 – 20,730), the targets will stand at 20,888.50 – 21,083.46 – 21,241.80, in line with classic Pivot resistance.
***
Indicators used in technical analysis:
Higher time frames – Ichimoku Kinko Hyo (9.26.52) + Fibo Kijun
H1 – Pivot Points (classic) + Moving Average (120) (weekly long-term trend)
You have already liked this post today
*The market analysis posted here is meant to increase your awareness, but not to give instructions to make a trade.
Early in the American session, the EUR/USD pair is trading around 1.1358 within the downtrend channel formed on April 18. The pair is under bearish pressure. We believe the instrument
Useful links: My other articles are available in this section InstaForex course for beginners Popular Analytics Open trading account Important: The begginers in forex trading need to be very careful
On the 4-hour chart, the Silver commodity instrument is visible even though its condition is strengthening where this is confirmed by the movement of the Silver price which is moving
Our trading plan for the next few hours is to sell gold below $3,333, with targets at $3,313 and $3,291. We can buy above $3,280 with short-term targets at $3,437
With the appearance of Divergence between the price movement of the AUD/JPY cross currency pair with the Stochastic Oscillator indicator and the price movement of AUD/JPY which is above
If we look at the 4-hour chart, the Gold commodity instrument appears to still be moving in a Bullish bias, but with the appearance of Divergence between the Gold price
Useful links: My other articles are available in this section InstaForex course for beginners Popular Analytics Open trading account Important: The begginers in forex trading need to be very careful
If we look at the 4-hour chart of the GBP/CHF cross currency pair, there are several interesting facts. First, the appearance of a Triangle pattern followed by the movement
Forex Chart
Web-version

Your IP address shows that you are currently located in the USA. If you are a resident of the United States, you are prohibited from using the services of InstaFintech Group including online trading, online transfers, deposit/withdrawal of funds, etc.
If you think you are seeing this message by mistake and your location is not the US, kindly proceed to the website. Otherwise, you must leave the website in order to comply with government restrictions.
Why does your IP address show your location as the USA?
Please confirm whether you are a US resident or not by clicking the relevant button below. If you choose the wrong option, being a US resident, you will not be able to open an account with InstaTrade anyway.
We are sorry for any inconvenience caused by this message.


