See also


 31.05.2023 07:07 AM
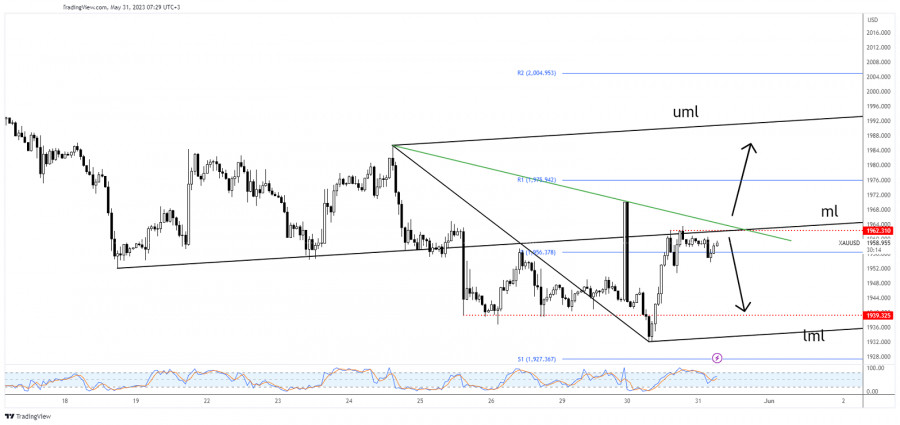
The price of gold is located at 1,959 at the time of writing and is struggling to stay higher. Despite the USD's appreciation versus its rivals, the yellow metal stands right below yesterday's high of 1,963.
Surprisingly or not, the XAU/USD remains bullish in the short term even if the US CB Consumer Confidence came in better than expected yesterday. Today, the Australian CPI reported a 6.8% growth exceeding the 6.4% growth estimated. Later, the German Prelim CPI, the Canadian GDP, and the US JOLTS Job Openings represent major events and could bring high volatility.
XAU/USD stays near the ascending pitchfork's median line (ml), 1,962 static resistance, and below the minor downtrend line. These represent upside obstacles. It remains to see how it reacts as the fundamentals factors should drive the rate.
Technically, staying around the resistance levels may announce strong upside pressure and an imminent breakout.
You knew from my yesterday's analysis that XAU/USD should activate a broader rebound after jumping and closing above the median line (ml). A bullish closure above the downtrend line and stabilizing beyond the median line (ml) is seen as a buying signal.
Still, don't forget that false breakouts through the resistance levels may announce a new sell-off.
You have already liked this post today
*The market analysis posted here is meant to increase your awareness, but not to give instructions to make a trade.
In my morning forecast, I highlighted the 1.1374 level and planned to make trading decisions based on it. Let's look at the 5-minute chart to analyze what happened. A decline
The GBP/USD currency pair also traded higher on Monday, although it pulled back slightly during the day. This retreat followed the announcement that the increase in tariffs for the European
On Monday, the EUR/USD currency pair initially rose following Trump's announcement that tariffs on EU goods would increase to 50% starting June 1. However, the pair subsequently fell after Trump
Analysis of Friday's Trades 1H Chart of GBP/USD The GBP/USD pair also showed a confident upward movement on Friday, driven by the overall uptrend observed over the past two weeks
Analysis of Friday's Trades 1H Chart of EUR/USD On Friday, the EUR/USD currency pair continued its upward movement after bouncing from the 1.1267 level during a brief correction. The uptrend
Your IP address shows that you are currently located in the USA. If you are a resident of the United States, you are prohibited from using the services of InstaFintech Group including online trading, online transfers, deposit/withdrawal of funds, etc.
If you think you are seeing this message by mistake and your location is not the US, kindly proceed to the website. Otherwise, you must leave the website in order to comply with government restrictions.
Why does your IP address show your location as the USA?
Please confirm whether you are a US resident or not by clicking the relevant button below. If you choose the wrong option, being a US resident, you will not be able to open an account with InstaTrade anyway.
We are sorry for any inconvenience caused by this message.

