See also


 28.09.2022 09:35 AM
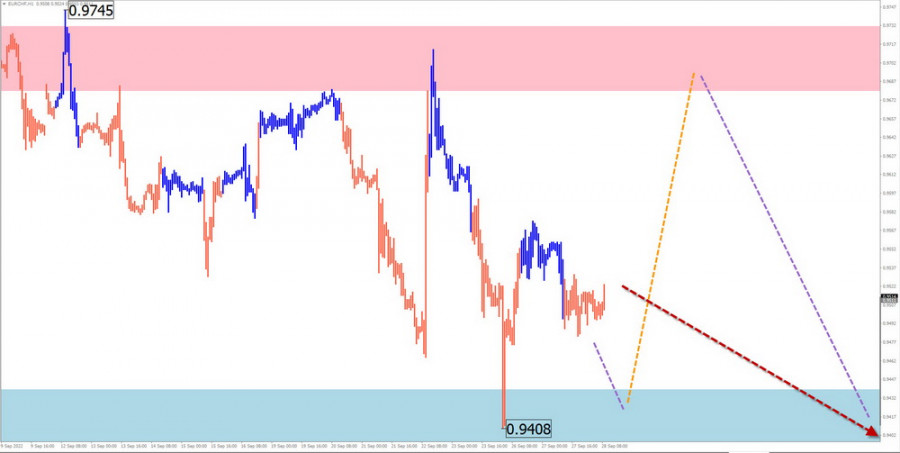
EUR/CHF
Brief analysis:
For the past four years, the cross pair has been moving downwards. The latest section of the trend was formed on June 9. At the moment, its structure doesn't look complete. The descending section of September 22 has the potential to reverse. The price has reached the upper boundary of a strong support zone on the monthly chart.
Weekly forecast:
In the coming days, the quote is expected to move in the sideways channel between the opposite zones. The support zone may come under pressure until the end of the week. After that, the trend may reverse, and the price may rise towards the resistance area.
Potential reversal zones
Resistance:
- 0.9680/0.9730
Support:
- 0.9440/0.9390
Recommendations
Sell: only with small lots within certain sessions.
Buy: after confirmed reversal signals appear in the support zones.
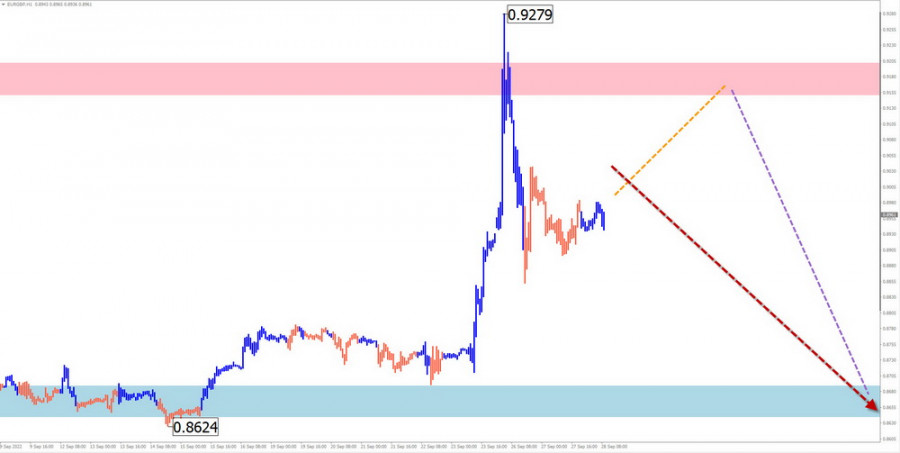
EUR/GBP
Brief analysis:
The cross pair is mainly trading in the sideways channel. The descending wave pattern which was initiated in March 2020 is incomplete. The middle part B of the wave structure is nearing its completion. The descending section formed on September 26 has the potential to reverse. If so, this will indicate the beginning of the final section (C).
Weekly forecast:
The EUR/GBP pair will continue to move upwards at least until the end of the week. The price may reach the resistance zone. It is highly likely that at the start of the next week, the pair will reverse and resume its downtrend.
Potential reversal zones
Resistance:
- 0.9150/0.9200
Support:
- 0.8690/0.8630
Recommendations
Buy: only with small lots within certain sessions.
Sell: after confirmed reversal signals appear near the resistance zone
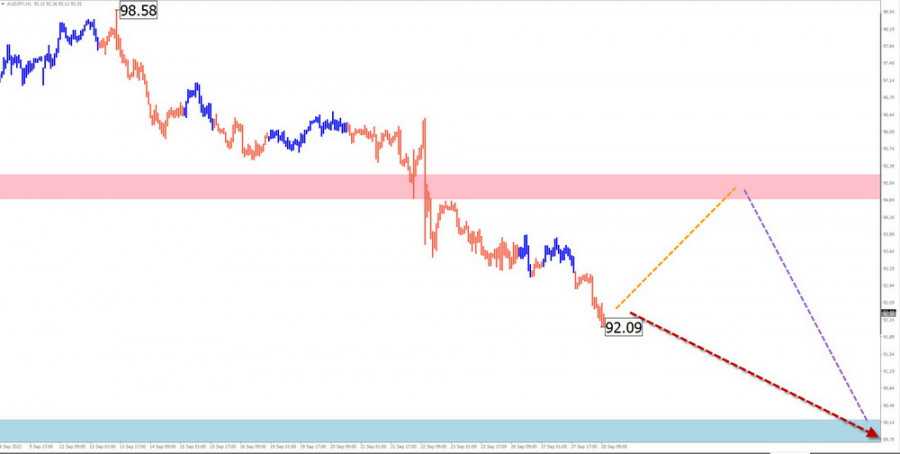
AUD/JPY
Brief analysis:
Since April this year, a corrective wave has been forming at the end of the current trend. Its structure resembles a sliding channel. The pair is building the final section of the wave.
Weekly forecast:
In the coming week, the price is likely to move within the downtrend. The pair may enter a flat channel until the end of the week. It may also shortly reach the level of resistance. A more rapid decline is likely at the start of the next weekly session.
Potential reversal zones
Resistance:
- 94.70/95.20
Support:
- 90.20/89.70
Recommendations
Buy: it is not recommended to buy high-risk assets at the moment.
Sell: after getting reversal signals confirmed by your trading system near the reversal zone.
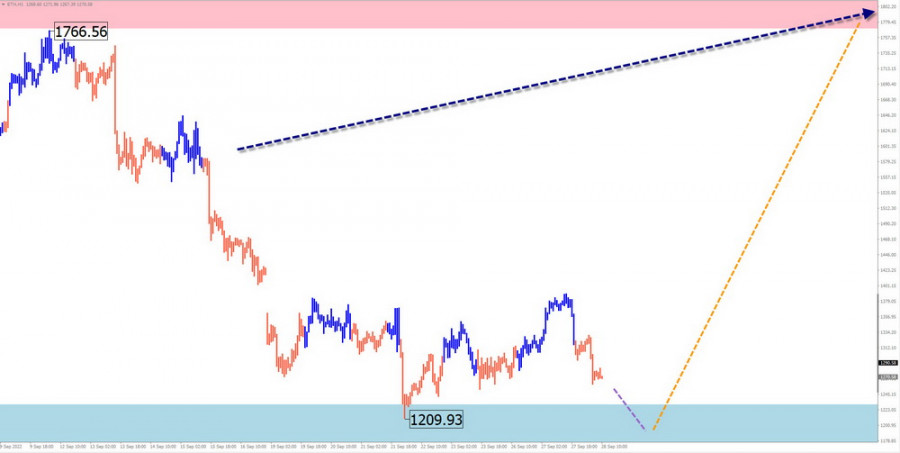
#Ethereum
Brief analysis:
On the daily chart, Ethereum has been moving downwards according to the descending wave structure since November last year. Since mid-July, the price entered a flat channel and formed an interim correction. This wave structure is lacking the final part C. Currently, no reversal signals can be seen on the chart.
Weekly forecast:
Until the end of the week, the altcoin is expected to trade sideways near the estimated support zone. The price is likely to start a reversal and change the direction in the next weekly session.
Potential reversal zones
Resistance:
- 1770.0/1870.0
Support:
- 1230.0/1130.0
Recommendations
Sell: not recommended in the near term.
Buy: after confirmed reversal signals appear near the support zone.
Explanation: In simplified wave analysis (SWA), the wave consists of 3 parts (A-B-C). We analyze the incomplete section of the wave for a certain time frame. The expected trajectory of the price is shown by the dotted line on the chart.
Note: the wave analysis does not take into account the movement of the instrument in time!
You have already liked this post today
*The market analysis posted here is meant to increase your awareness, but not to give instructions to make a trade.
GBP/USD Analysis: Since January, the British pound has been trending upward. The current incomplete segment began on April 8. Within this wave, the final segment remains unfinished. The price
EUR/USD Analysis: Since April, the euro's primary pair has been forming a descending horizontal pennant. From a strong, potentially reversal zone on the daily timeframe in mid-May, the price began

Your IP address shows that you are currently located in the USA. If you are a resident of the United States, you are prohibited from using the services of InstaFintech Group including online trading, online transfers, deposit/withdrawal of funds, etc.
If you think you are seeing this message by mistake and your location is not the US, kindly proceed to the website. Otherwise, you must leave the website in order to comply with government restrictions.
Why does your IP address show your location as the USA?
Please confirm whether you are a US resident or not by clicking the relevant button below. If you choose the wrong option, being a US resident, you will not be able to open an account with InstaTrade anyway.
We are sorry for any inconvenience caused by this message.


