

Actual patterns

Patterns are graphical models which are formed in the chart by the price. According to one of the technical analysis postulates, history (price movement) repeats itself. It means that the price movements are often similar in the same situations which makes it possible to predict the further development of the situation with a high probability.
Relevant patterns by InstaTrade is an easy-to-use service which allows you to be aware of latest changes in the market and react to clues from the market in time. In our service you will always find the latest and most relevant patterns on any pair and any timeframe.
Inverse Head and Shoulder
was formed on 14.04 at 23:05:42 (UTC+0)
signal strength 1 of 5
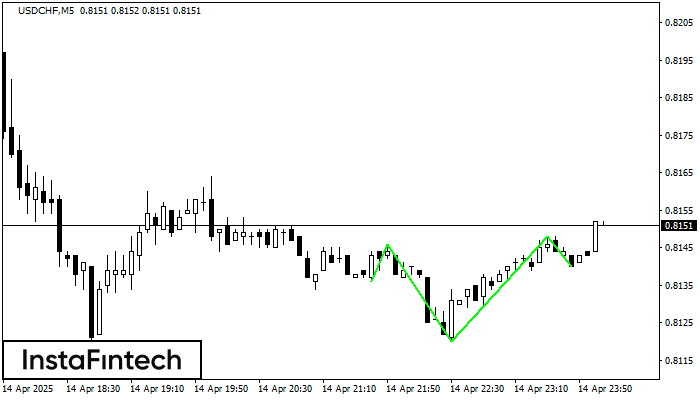
According to the chart of M5, USDCHF formed the Inverse Head and Shoulder pattern. The Head’s top is set at 0.8148 while the median line of the Neck is found at 0.8120/0.8140. The formation of the Inverse Head and Shoulder pattern evidently signals a reversal of the downward trend. In other words, in case the scenario comes true, the price of USDCHF will go towards 0.8163
The M5 and M15 time frames may have more false entry points.
- All
- All
- Bearish Rectangle
- Bearish Symmetrical Triangle
- Bearish Symmetrical Triangle
- Bullish Rectangle
- Double Top
- Double Top
- Triple Bottom
- Triple Bottom
- Triple Top
- Triple Top
- All
- All
- Buy
- Sale
- All
- 1
- 2
- 3
- 4
- 5
Triple Bottom
was formed on 06.06 at 22:01:08 (UTC+0)
signal strength 3 of 5

Corak Triple Bottom telah dibentuk pada carta bagi instrumen dagangan GBPAUD M30. Corak menandakan perubahan aliran dari menurun ke aliran menaik dalam sekiranya penembusan 2.0879/2.0852
Open chart in a new window
Triple Top
was formed on 06.06 at 22:00:38 (UTC+0)
signal strength 1 of 5
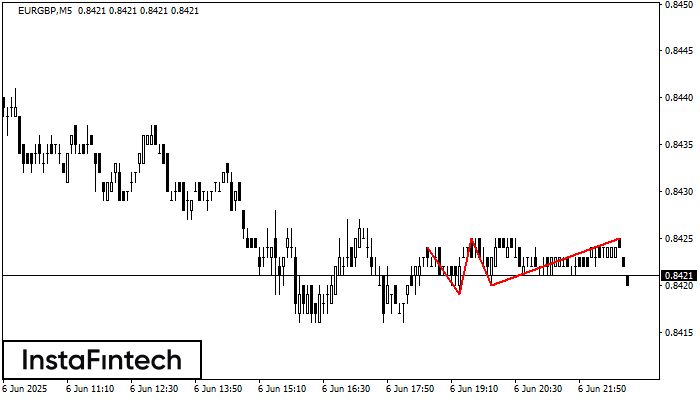
Pada carta instrumen dagangan EURGBP M5, corak Triple Top yang menandakan perubahan aliran telah terbentuk. Adalah mungkin bahawa selepas pembentukan bahagian atas ketiga, harga akan cuba menembusi tahap rintangan 0.8419
Carta masa M5 dan M15 mungkin mempunyai lebih banyak titik kemasukan palsu.
Open chart in a new window
Double Top
was formed on 06.06 at 21:30:31 (UTC+0)
signal strength 2 of 5
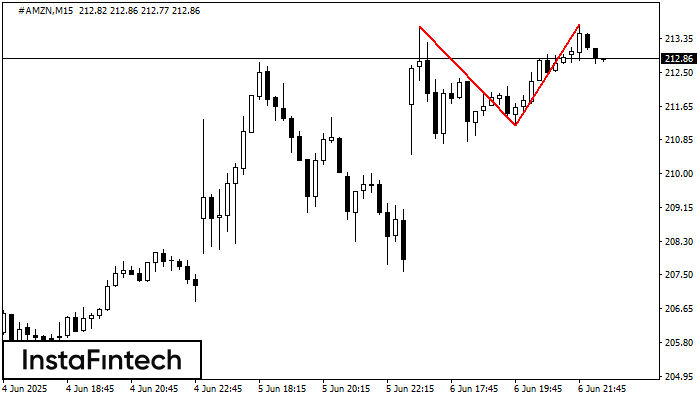
Corak pembalikan Double Top telah dibentuk pada #AMZN M15. Ciri-ciri: sempadan atas %P0.000000; sempadan bawah 213.64; sempadan bawah 211.18; lebar corak adalah 252 mata. Dagangan menjual adalah lebih baik untuk
Carta masa M5 dan M15 mungkin mempunyai lebih banyak titik kemasukan palsu.
Open chart in a new window


