

Actual patterns

Patterns are graphical models which are formed in the chart by the price. According to one of the technical analysis postulates, history (price movement) repeats itself. It means that the price movements are often similar in the same situations which makes it possible to predict the further development of the situation with a high probability.
Relevant patterns by InstaTrade is an easy-to-use service which allows you to be aware of latest changes in the market and react to clues from the market in time. In our service you will always find the latest and most relevant patterns on any pair and any timeframe.
Triple Bottom
was formed on 03.04 at 23:00:23 (UTC+0)
signal strength 1 of 5
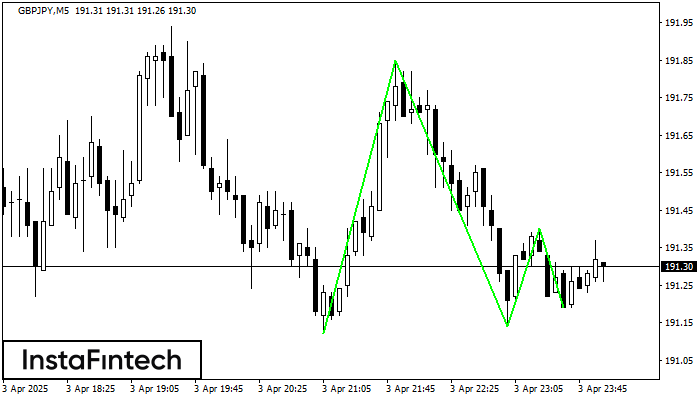
The Triple Bottom pattern has formed on the chart of GBPJPY M5. Features of the pattern: The lower line of the pattern has coordinates 191.85 with the upper limit 191.85/191.40, the projection of the width is 73 points. The formation of the Triple Bottom pattern most likely indicates a change in the trend from downward to upward. This means that in the event of a breakdown of the resistance level 191.12, the price is most likely to continue the upward movement.
The M5 and M15 time frames may have more false entry points.
See Also
- All
- All
- Bearish Rectangle
- Bearish Symmetrical Triangle
- Bearish Symmetrical Triangle
- Bullish Rectangle
- Double Top
- Double Top
- Triple Bottom
- Triple Bottom
- Triple Top
- Triple Top
- All
- All
- Buy
- Sale
- All
- 1
- 2
- 3
- 4
- 5
Đỉnh ba
was formed on 23.09 at 02:30:27 (UTC+0)
signal strength 3 of 5
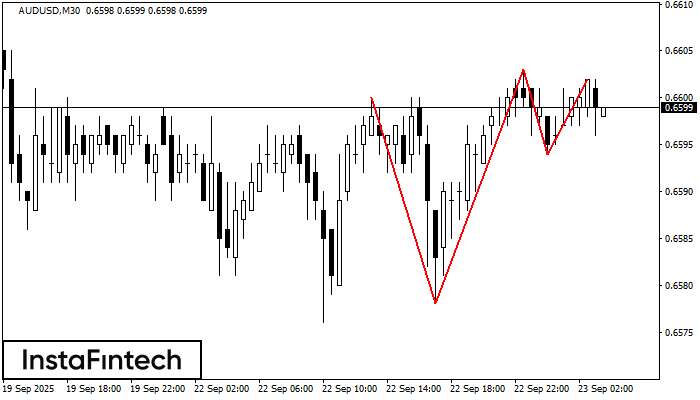
Trên biểu đồ của công cụ giao dịch AUDUSD M30, mô hình Đỉnh ba báo hiệu sự thay đổi xu hướng đã hình thành. Có thể sau khi hình thành
Open chart in a new window
Tam giác Cân Tăng
was formed on 22.09 at 20:17:21 (UTC+0)
signal strength 2 of 5
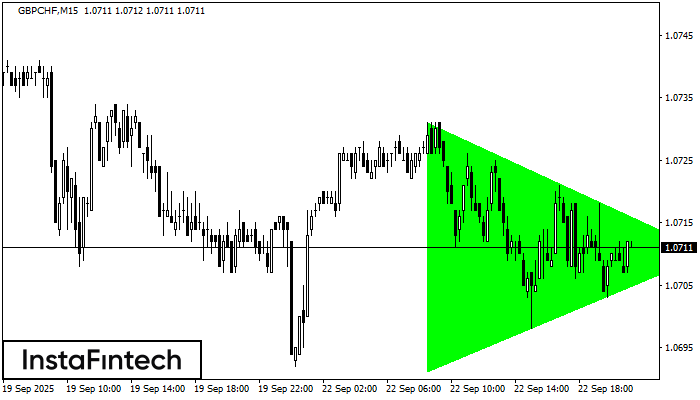
Theo biểu đồ của M15, GBPCHF đã hình thành mô hình Tam giác Cân Tăng. Mô tả: Đây là mô hình của sự tiếp tục xu hướng. 1.0731 và 1.0691
Khung thời gian M5 và M15 có thể có nhiều điểm vào lệnh sai hơn.
Open chart in a new window
Cờ hiệu tăng
was formed on 22.09 at 17:45:07 (UTC+0)
signal strength 2 of 5
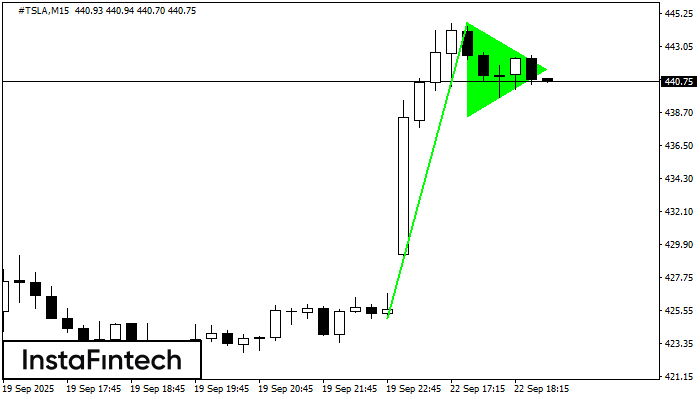
Mô hình Cờ hiệu tăng được hình thành trên biểu đồ #TSLA M15. Nó là một loại của mô hình tiếp tục. Giả sử, trong trường hợp giá được
Khung thời gian M5 và M15 có thể có nhiều điểm vào lệnh sai hơn.
Open chart in a new window


