

Actual patterns

Patterns are graphical models which are formed in the chart by the price. According to one of the technical analysis postulates, history (price movement) repeats itself. It means that the price movements are often similar in the same situations which makes it possible to predict the further development of the situation with a high probability.
Relevant patterns by InstaTrade is an easy-to-use service which allows you to be aware of latest changes in the market and react to clues from the market in time. In our service you will always find the latest and most relevant patterns on any pair and any timeframe.
Bullish Rectangle
was formed on 28.03 at 22:34:02 (UTC+0)
signal strength 3 of 5

According to the chart of M30, GOLD formed the Bullish Rectangle which is a pattern of a trend continuation. The pattern is contained within the following borders: the lower border 3065.51 – 3065.51 and upper border 3086.32 – 3086.32. In case the upper border is broken, the instrument is likely to follow the upward trend.
See Also
- All
- All
- Bearish Rectangle
- Bearish Symmetrical Triangle
- Bearish Symmetrical Triangle
- Bullish Rectangle
- Double Top
- Double Top
- Triple Bottom
- Triple Bottom
- Triple Top
- Triple Top
- All
- All
- Buy
- Sale
- All
- 1
- 2
- 3
- 4
- 5
Прямоугольник
сформирован 02.06 в 13:16:37 (UTC+0)
сила сигнала 1 из 5
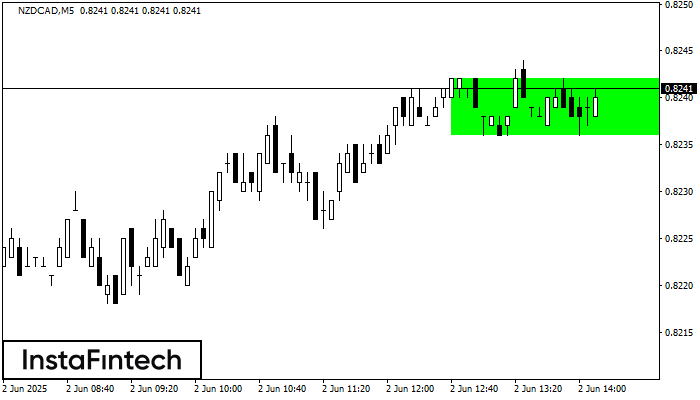
Сформирована фигура «Прямоугольник» на графике NZDCAD M5. Тип фигуры: Продолжение тренда; Границы: Верхняя 0.8242, Нижняя 0.8236; Сигнал: позицию на покупку следует открывать выше верхней границы прямоугольника 0.8242
Таймфреймы М5 и М15 могут иметь больше ложных точек входа.
Открыть график инструмента в новом окне
Прямоугольник
сформирован 02.06 в 13:12:18 (UTC+0)
сила сигнала 1 из 5
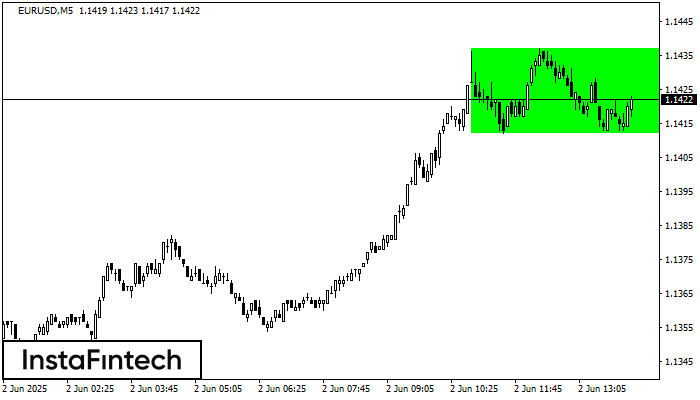
По EURUSD на M5 сформировалась фигура «Прямоугольник». Фигура данного типа относится к тому типу продолжения тренда, который содержит в себе два уровня: Сопротивление 1.1437; Поддержка 1.1412. В случае пробоя уровня
Таймфреймы М5 и М15 могут иметь больше ложных точек входа.
Открыть график инструмента в новом окне
Двойная вершина
сформирован 02.06 в 13:05:05 (UTC+0)
сила сигнала 1 из 5
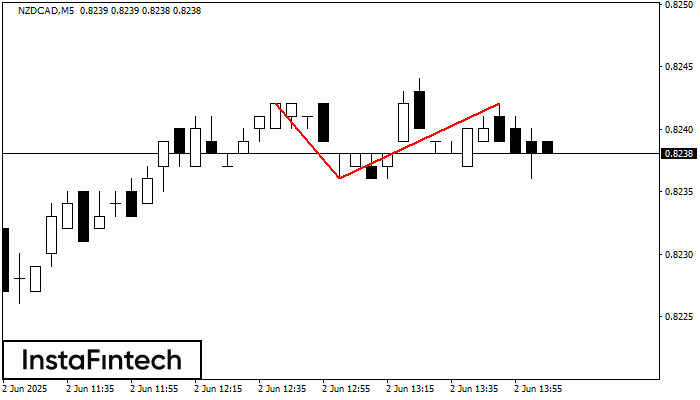
По NZDCAD на M5 сформировалась разворотная фигура «Двойная вершина». Характеристика: Верхняя граница 0.8242; Нижняя граница 0.8236; Ширина фигуры 6 пунктов. Позицию на продажу возможно открыть ниже нижней границы 0.8236
Таймфреймы М5 и М15 могут иметь больше ложных точек входа.
Открыть график инструмента в новом окне


