

Actual patterns

Patterns are graphical models which are formed in the chart by the price. According to one of the technical analysis postulates, history (price movement) repeats itself. It means that the price movements are often similar in the same situations which makes it possible to predict the further development of the situation with a high probability.
Relevant patterns by InstaTrade is an easy-to-use service which allows you to be aware of latest changes in the market and react to clues from the market in time. In our service you will always find the latest and most relevant patterns on any pair and any timeframe.
Bullish Flag
was formed on 28.03 at 01:00:48 (UTC+0)
signal strength 3 of 5
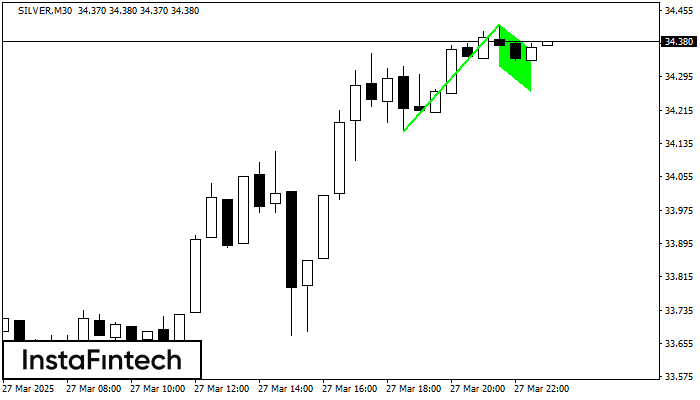
The Bullish Flag pattern has been formed on SILVER at M30. The lower boundary of the pattern is located at 34.32/34.26, while the higher boundary lies at 34.42/34.36. The projection of the flagpole is 255 points. This formation signals that the upward trend is most likely to continue. Therefore, if the level of 34.42 is broken, the price will move further upwards.
- All
- All
- Bearish Rectangle
- Bearish Symmetrical Triangle
- Bearish Symmetrical Triangle
- Bullish Rectangle
- Double Top
- Double Top
- Triple Bottom
- Triple Bottom
- Triple Top
- Triple Top
- All
- All
- Buy
- Sale
- All
- 1
- 2
- 3
- 4
- 5
Тройная вершина
сформирован 03.06 в 02:30:47 (UTC+0)
сила сигнала 3 из 5
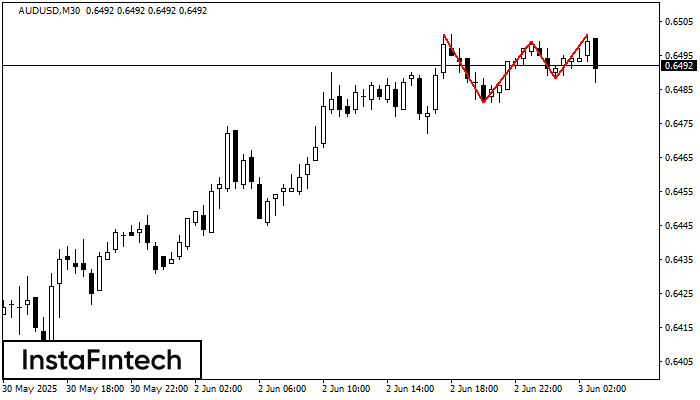
На графике AUDUSD M30 образовалась фигура «Тройная вершина». Данная фигура относится к типу разворотных и имеет характеристику: Верхняя граница 0.6501/0.6501; Нижняя граница 0.6481/0.6488; Ширина фигуры 11 пунктов. Прогноз: В случае
Открыть график инструмента в новом окне
Двойное дно
сформирован 03.06 в 02:30:25 (UTC+0)
сила сигнала 3 из 5
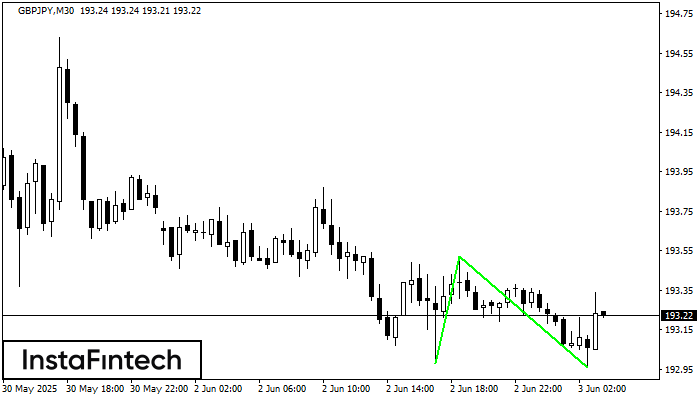
Сформирована фигура «Двойное дно» на графике GBPJPY M30. Данное формирование сигнализирует об изменении тенденции с нисходящего на восходящее движение. Сигнал: Торговую позицию на покупку следует открывать после пробоя верхней границы
Открыть график инструмента в новом окне
Тройная вершина
сформирован 03.06 в 02:16:29 (UTC+0)
сила сигнала 2 из 5
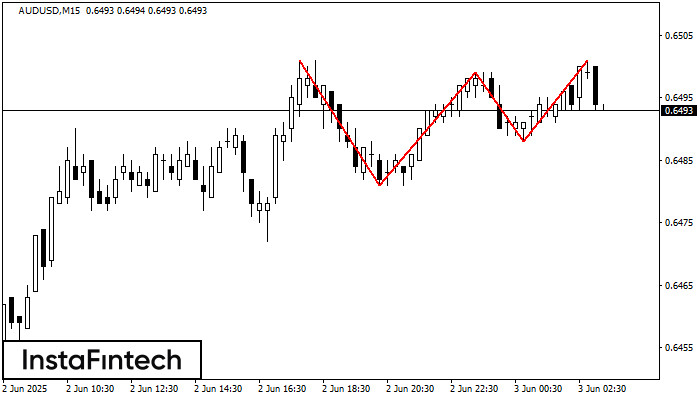
На графике AUDUSD M15 образовалась фигура «Тройная вершина». Данная фигура относится к типу разворотных и имеет характеристику: Верхняя граница 0.6501/0.6501; Нижняя граница 0.6481/0.6488; Ширина фигуры 11 пунктов. Прогноз: В случае
Таймфреймы М5 и М15 могут иметь больше ложных точек входа.
Открыть график инструмента в новом окне


