

Actual patterns

Patterns are graphical models which are formed in the chart by the price. According to one of the technical analysis postulates, history (price movement) repeats itself. It means that the price movements are often similar in the same situations which makes it possible to predict the further development of the situation with a high probability.
Relevant patterns by InstaTrade is an easy-to-use service which allows you to be aware of latest changes in the market and react to clues from the market in time. In our service you will always find the latest and most relevant patterns on any pair and any timeframe.
Bearish Rectangle
was formed on 21.03 at 15:02:37 (UTC+0)
signal strength 3 of 5
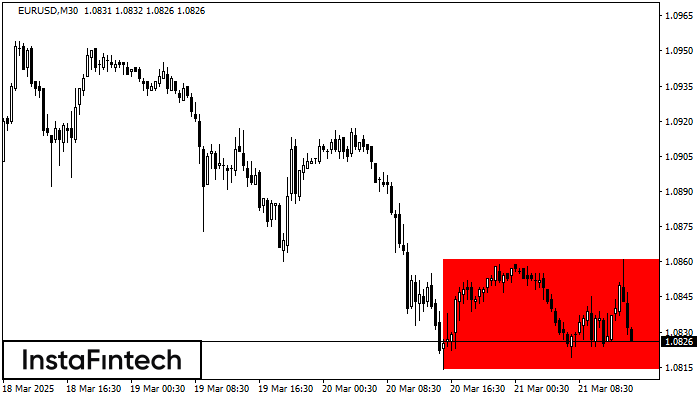
According to the chart of M30, EURUSD formed the Bearish Rectangle. The pattern indicates a trend continuation. The upper border is 1.0861, the lower border is 1.0814. The signal means that a short position should be opened after fixing a price below the lower border 1.0814 of the Bearish Rectangle.
See Also
- All
- All
- Bearish Rectangle
- Bearish Symmetrical Triangle
- Bearish Symmetrical Triangle
- Bullish Rectangle
- Double Top
- Double Top
- Triple Bottom
- Triple Bottom
- Triple Top
- Triple Top
- All
- All
- Buy
- Sale
- All
- 1
- 2
- 3
- 4
- 5
Double Top
was formed on 02.06 at 23:17:32 (UTC+0)
signal strength 2 of 5
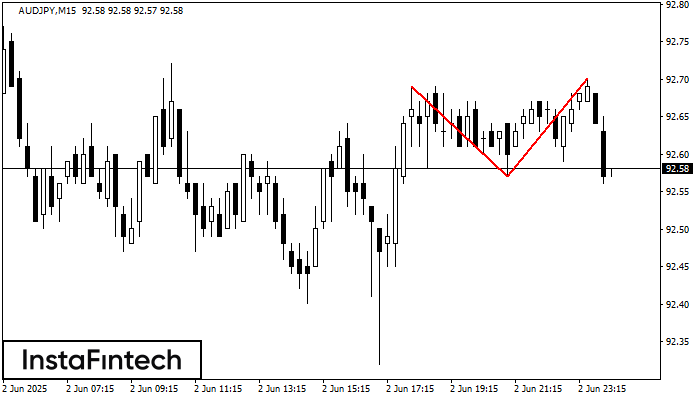
Corak Double Top telah dibentuk pada AUDJPY M15. Isyarat bahawa aliran telah berubah dari aliran menaik ke aliran menurun. Mungkin, sekiranya asas corak 92.57 ditembusi, pergerakan menurun akan berterusan
Carta masa M5 dan M15 mungkin mempunyai lebih banyak titik kemasukan palsu.
Open chart in a new window
Triple Top
was formed on 02.06 at 23:11:50 (UTC+0)
signal strength 1 of 5
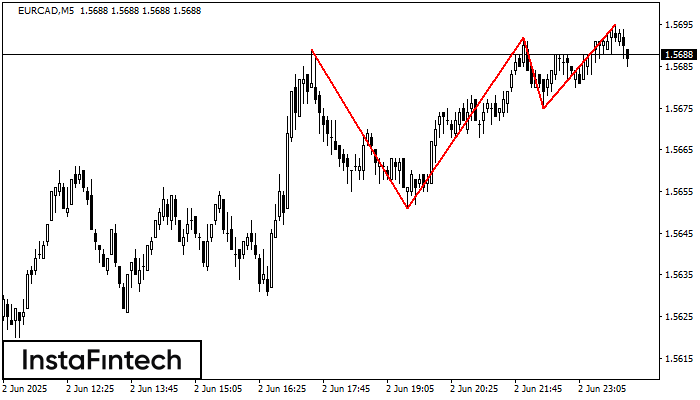
Corak Triple Top telah dibentuk pada carta EURCAD M5. Ciri corak: sempadan mempunyai sudut menaik; garisan bawah corak mempunyai koordinat 1.5651/1.5675 dengan had atas 1.5689/1.5695; unjuran lebar ialah 38 mata
Carta masa M5 dan M15 mungkin mempunyai lebih banyak titik kemasukan palsu.
Open chart in a new window
Double Top
was formed on 02.06 at 23:00:37 (UTC+0)
signal strength 5 of 5
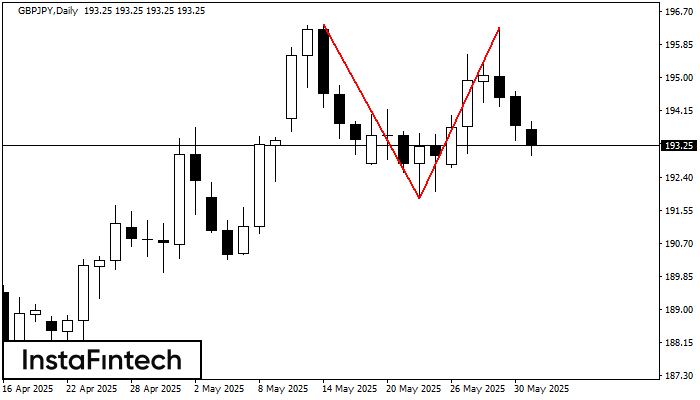
Corak pembalikan Double Top telah dibentuk pada GBPJPY D1. Ciri-ciri: sempadan atas %P0.000000; sempadan bawah 196.38; sempadan bawah 191.87; lebar corak adalah 441 mata. Dagangan menjual adalah lebih baik untuk
Open chart in a new window


