

Actual patterns

Patterns are graphical models which are formed in the chart by the price. According to one of the technical analysis postulates, history (price movement) repeats itself. It means that the price movements are often similar in the same situations which makes it possible to predict the further development of the situation with a high probability.
Relevant patterns by InstaTrade is an easy-to-use service which allows you to be aware of latest changes in the market and react to clues from the market in time. In our service you will always find the latest and most relevant patterns on any pair and any timeframe.
Triple Top
was formed on 14.04 at 22:30:39 (UTC+0)
signal strength 3 of 5
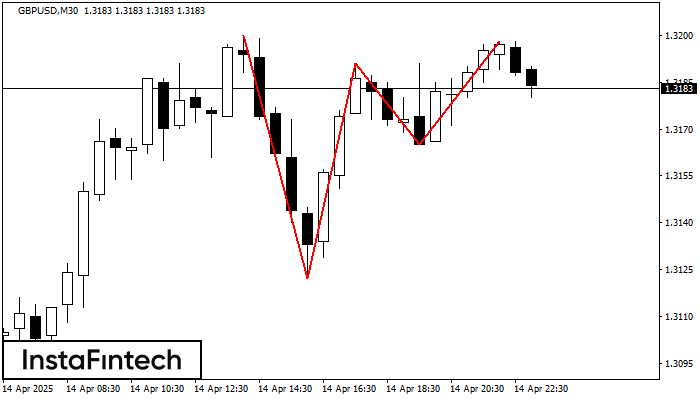
The Triple Top pattern has formed on the chart of the GBPUSD M30 trading instrument. It is a reversal pattern featuring the following characteristics: resistance level 2, support level -43, and pattern’s width 78. Forecast If the price breaks through the support level 1.3122, it is likely to move further down to 1.3161.
- All
- All
- Bearish Rectangle
- Bearish Symmetrical Triangle
- Bearish Symmetrical Triangle
- Bullish Rectangle
- Double Top
- Double Top
- Triple Bottom
- Triple Bottom
- Triple Top
- Triple Top
- All
- All
- Buy
- Sale
- All
- 1
- 2
- 3
- 4
- 5
Rectángulo Bajista
was formed on 23.05 at 23:00:20 (UTC+0)
signal strength 1 of 5

Según el gráfico de M5, EURNZD formó el Rectángulo Bajista. El patrón indica la continuación de una tendencia. El límite superior es 1.8982, el límite inferior es 1.8964. La señal
Los marcos de tiempo M5 y M15 pueden tener más puntos de entrada falsos.
Open chart in a new window
Triángulo Simétrico Alcista
was formed on 23.05 at 22:14:53 (UTC+0)
signal strength 1 of 5

Según el gráfico de M5, AUDCHF formó el patrón Triángulo Simétrico Alcista. Descripción: Este es el patrón de la continuación de una tendencia. 0.5335 y 0.5329 son las coordenadas
Los marcos de tiempo M5 y M15 pueden tener más puntos de entrada falsos.
Open chart in a new window
Triángulo Simétrico Alcista
was formed on 23.05 at 22:10:58 (UTC+0)
signal strength 1 of 5

Según el gráfico de M5, AUDJPY formó el patrón Triángulo Simétrico Alcista. Descripción: Este es el patrón de la continuación de una tendencia. 92.60 y 92.44 son las coordenadas
Los marcos de tiempo M5 y M15 pueden tener más puntos de entrada falsos.
Open chart in a new window


