

Actual patterns

Patterns are graphical models which are formed in the chart by the price. According to one of the technical analysis postulates, history (price movement) repeats itself. It means that the price movements are often similar in the same situations which makes it possible to predict the further development of the situation with a high probability.
Relevant patterns by InstaTrade is an easy-to-use service which allows you to be aware of latest changes in the market and react to clues from the market in time. In our service you will always find the latest and most relevant patterns on any pair and any timeframe.
Bullish Symmetrical Triangle
was formed on 10.04 at 19:35:35 (UTC+0)
signal strength 1 of 5
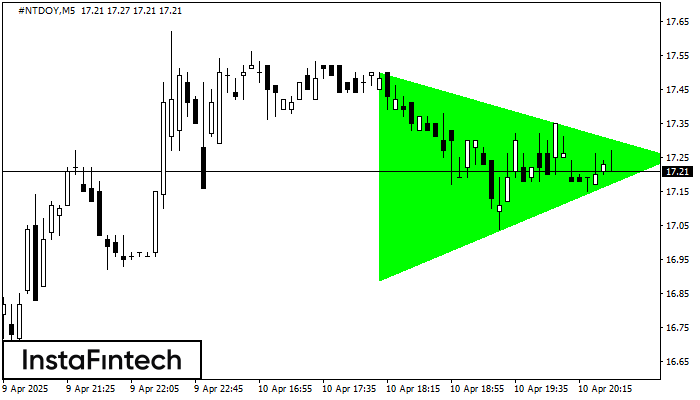
According to the chart of M5, #NTDOY formed the Bullish Symmetrical Triangle pattern. Description: This is the pattern of a trend continuation. 17.50 and 16.89 are the coordinates of the upper and lower borders respectively. The pattern width is measured on the chart at 61 pips. Outlook: If the upper border 17.50 is broken, the price is likely to continue its move by 17.40.
The M5 and M15 time frames may have more false entry points.
- All
- All
- Bearish Rectangle
- Bearish Symmetrical Triangle
- Bearish Symmetrical Triangle
- Bullish Rectangle
- Double Top
- Double Top
- Triple Bottom
- Triple Bottom
- Triple Top
- Triple Top
- All
- All
- Buy
- Sale
- All
- 1
- 2
- 3
- 4
- 5
Segi Empat Menaik
was formed on 25.05 at 07:55:30 (UTC+0)
signal strength 1 of 5

Berdasarkan carta M5, #Bitcoin telah membentuk Segi Empat Menaik yang merupakan corak kesinambungan aliran. Corak adalah terkandung dalam sempadan berikut: sempadan bawah 107891.05 – 107891.05 dan sempadan atas 108246.73 –
Carta masa M5 dan M15 mungkin mempunyai lebih banyak titik kemasukan palsu.
Open chart in a new window
Segi Tiga Simetri Menaik
was formed on 24.05 at 18:46:25 (UTC+0)
signal strength 2 of 5

Berdasarkan carta M15, #Bitcoin membentuk corak Segi Tiga Simetri Menaik yang menandakan aliran akan berterusan. Penerangan. Sempadan atas corak menyentuh koordinat 109440.14/108872.57 sedangkan sempadan bawah merentasi 108311.13/108872.57. Lebar corak diukur
Carta masa M5 dan M15 mungkin mempunyai lebih banyak titik kemasukan palsu.
Open chart in a new window
Segi Empat Menurun
was formed on 23.05 at 23:00:20 (UTC+0)
signal strength 1 of 5

Berdasarkan carta M5, EURNZD telah membentuk Segi Empat Menurun. Corak ini menunjukkan kesinambungan aliran. Sempadan atas adalah 1.8982, sempadan bawah adalah 1.8964. Isyarat bermakna bahawa kedudukan pendek perlu dibuka selepas
Carta masa M5 dan M15 mungkin mempunyai lebih banyak titik kemasukan palsu.
Open chart in a new window


