

Actual patterns

Patterns are graphical models which are formed in the chart by the price. According to one of the technical analysis postulates, history (price movement) repeats itself. It means that the price movements are often similar in the same situations which makes it possible to predict the further development of the situation with a high probability.
Relevant patterns by InstaTrade is an easy-to-use service which allows you to be aware of latest changes in the market and react to clues from the market in time. In our service you will always find the latest and most relevant patterns on any pair and any timeframe.
Inverse Head and Shoulder
was formed on 09.04 at 04:04:54 (UTC+0)
signal strength 1 of 5

According to the chart of M5, NZDCAD formed the Inverse Head and Shoulder pattern. The Head’s top is set at 0.7878 while the median line of the Neck is found at 0.7826/0.7858. The formation of the Inverse Head and Shoulder pattern evidently signals a reversal of the downward trend. In other words, in case the scenario comes true, the price of NZDCAD will go towards 0.7893
The M5 and M15 time frames may have more false entry points.
- All
- All
- Bearish Rectangle
- Bearish Symmetrical Triangle
- Bearish Symmetrical Triangle
- Bullish Rectangle
- Double Top
- Double Top
- Triple Bottom
- Triple Bottom
- Triple Top
- Triple Top
- All
- All
- Buy
- Sale
- All
- 1
- 2
- 3
- 4
- 5
Двойная вершина
сформирован 23.05 в 15:00:07 (UTC+0)
сила сигнала 4 из 5
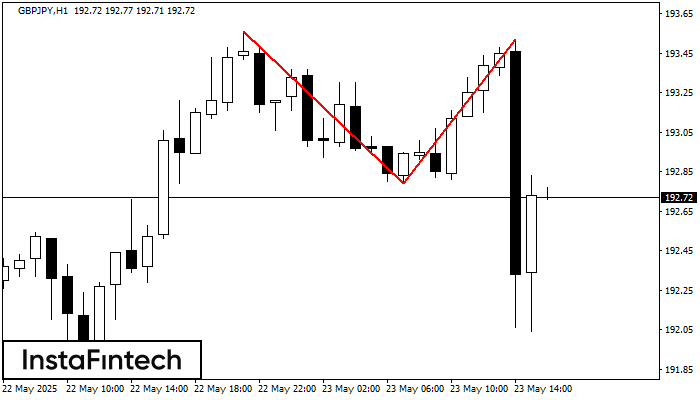
На торговом графике GBPJPY H1 сформировалась разворотная фигура «Двойная вершина». Характеристика: Верхняя граница 193.52; Нижняя граница 192.79; Ширина фигуры 73 пунктов. Сигнал: Пробой нижней границы 192.79 приведет к дальнейшему нисходящему
Открыть график инструмента в новом окне
Двойное дно
сформирован 23.05 в 15:00:03 (UTC+0)
сила сигнала 1 из 5
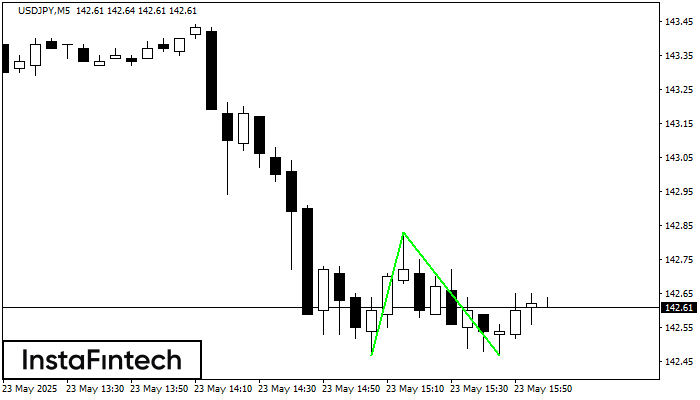
Сформирована фигура «Двойное дно» на графике USDJPY M5. Характеристика: Уровень поддержки 142.47; Уровень сопротивления 142.83; Ширина фигуры 36 пунктов. В случае пробоя уровня сопротивления можно будет прогнозировать изменение тенденции
Таймфреймы М5 и М15 могут иметь больше ложных точек входа.
Открыть график инструмента в новом окне
Двойная вершина
сформирован 23.05 в 14:00:05 (UTC+0)
сила сигнала 3 из 5
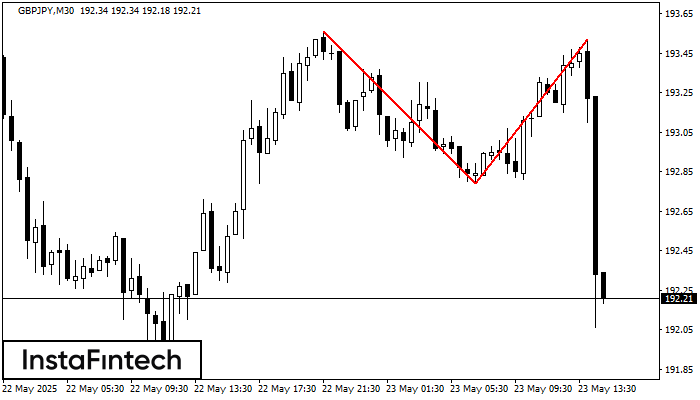
По GBPJPY на M30 сформировалась разворотная фигура «Двойная вершина». Характеристика: Верхняя граница 193.56; Нижняя граница 192.79; Ширина фигуры 73 пунктов. Позицию на продажу возможно открыть ниже нижней границы 192.79
Открыть график инструмента в новом окне


