

Actual patterns

Patterns are graphical models which are formed in the chart by the price. According to one of the technical analysis postulates, history (price movement) repeats itself. It means that the price movements are often similar in the same situations which makes it possible to predict the further development of the situation with a high probability.
Relevant patterns by InstaTrade is an easy-to-use service which allows you to be aware of latest changes in the market and react to clues from the market in time. In our service you will always find the latest and most relevant patterns on any pair and any timeframe.
Bullish Flag
was formed on 08.04 at 06:40:26 (UTC+0)
signal strength 1 of 5
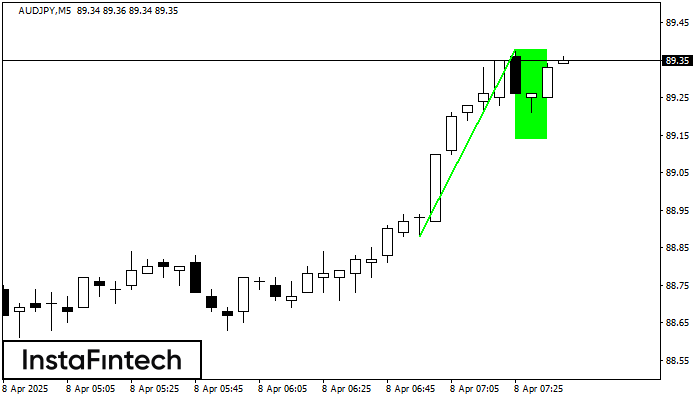
The Bullish Flag pattern has been formed on AUDJPY at M5. The lower boundary of the pattern is located at 89.14/89.14, while the higher boundary lies at 89.38/89.38. The projection of the flagpole is 50 points. This formation signals that the upward trend is most likely to continue. Therefore, if the level of 89.38 is broken, the price will move further upwards.
The M5 and M15 time frames may have more false entry points.
- All
- All
- Bearish Rectangle
- Bearish Symmetrical Triangle
- Bearish Symmetrical Triangle
- Bullish Rectangle
- Double Top
- Double Top
- Triple Bottom
- Triple Bottom
- Triple Top
- Triple Top
- All
- All
- Buy
- Sale
- All
- 1
- 2
- 3
- 4
- 5
Bearish Symmetrical Triangle
was formed on 28.05 at 07:55:12 (UTC+0)
signal strength 1 of 5

According to the chart of M5, NZDJPY formed the Bearish Symmetrical Triangle pattern. Description: The lower border is 85.44/85.92 and upper border is 86.64/85.92. The pattern width is measured
The M5 and M15 time frames may have more false entry points.
Open chart in a new window
Double Top
was formed on 28.05 at 07:40:44 (UTC+0)
signal strength 1 of 5
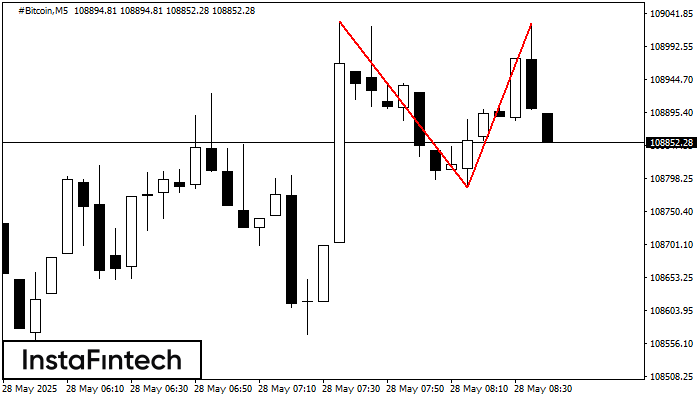
The Double Top pattern has been formed on #Bitcoin M5. It signals that the trend has been changed from upwards to downwards. Probably, if the base of the pattern 108785.65
The M5 and M15 time frames may have more false entry points.
Open chart in a new window
Double Bottom
was formed on 28.05 at 07:30:09 (UTC+0)
signal strength 2 of 5
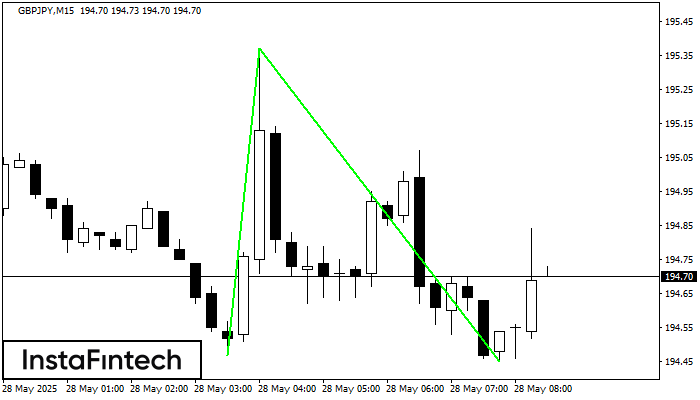
The Double Bottom pattern has been formed on GBPJPY M15; the upper boundary is 195.37; the lower boundary is 194.45. The width of the pattern is 90 points. In case
The M5 and M15 time frames may have more false entry points.
Open chart in a new window


