

Actual patterns

Patterns are graphical models which are formed in the chart by the price. According to one of the technical analysis postulates, history (price movement) repeats itself. It means that the price movements are often similar in the same situations which makes it possible to predict the further development of the situation with a high probability.
Relevant patterns by InstaTrade is an easy-to-use service which allows you to be aware of latest changes in the market and react to clues from the market in time. In our service you will always find the latest and most relevant patterns on any pair and any timeframe.
Bullish Symmetrical Triangle
was formed on 02.04 at 10:35:34 (UTC+0)
signal strength 1 of 5
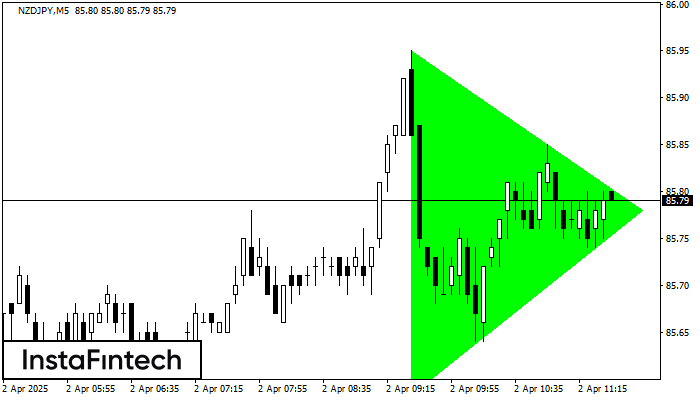
According to the chart of M5, NZDJPY formed the Bullish Symmetrical Triangle pattern, which signals the trend will continue. Description. The upper border of the pattern touches the coordinates 85.95/85.78 whereas the lower border goes across 85.58/85.78. The pattern width is measured on the chart at 37 pips. If the Bullish Symmetrical Triangle pattern is in progress during the upward trend, this indicates the current trend will go on. In case 85.78 is broken, the price could continue its move toward 85.93.
The M5 and M15 time frames may have more false entry points.
- All
- All
- Bearish Rectangle
- Bearish Symmetrical Triangle
- Bearish Symmetrical Triangle
- Bullish Rectangle
- Double Top
- Double Top
- Triple Bottom
- Triple Bottom
- Triple Top
- Triple Top
- All
- All
- Buy
- Sale
- All
- 1
- 2
- 3
- 4
- 5
डबल बॉटम
was formed on 22.04 at 03:50:50 (UTC+0)
signal strength 1 of 5
डबल बॉटम पैटर्न USDCAD M5 पर बना है। यह फॉर्मेशन नीचे से ऊपर की ओर प्रवृत्ति के उलट होने का संकेत देता है। संकेत यह है कि पैटर्न 1.3844 की
M5 और M15 समय सीमा में अधिक फाल्स एंट्री पॉइंट्स हो सकते हैं।
Open chart in a new window
ट्रिपल टॉप
was formed on 22.04 at 02:00:16 (UTC+0)
signal strength 3 of 5

ट्रिपल टॉप पैटर्न EURCAD M30 ट्रेडिंग इंस्ट्रूमेंट के चार्ट पर बना है। यह एक रीवर्सल पैटर्न है जिसमें निम्नलिखित विशेषताएं हैं: प्रतिरोध स्तर 14, समर्थन स्तर -60, और पैटर्न की
Open chart in a new window
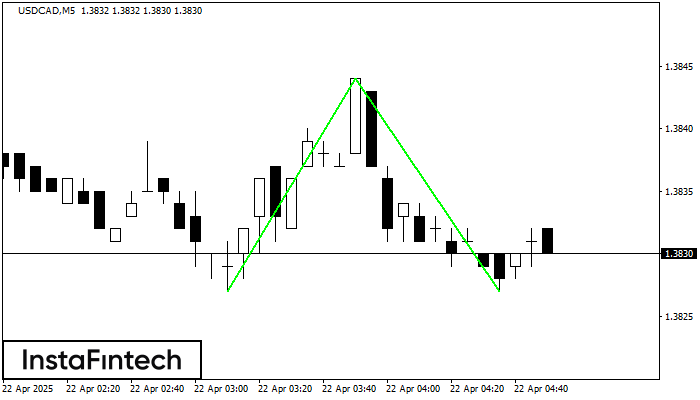
बुलिश सिमेट्रिकल त्रिभुज
was formed on 22.04 at 01:47:45 (UTC+0)
signal strength 2 of 5

M15 के चार्ट के अनुसार, USDCAD से बुलिश सिमेट्रिकल त्रिभुज पैटर्न बना, जो दर्शाता है कि ट्रेंड जारी रहेगा। विवरण: पैटर्न की ऊपरी सीमा निर्देशांक 1.3848/1.3836 को स्पर्श करती है
M5 और M15 समय सीमा में अधिक फाल्स एंट्री पॉइंट्स हो सकते हैं।
Open chart in a new window


