

实际模式

模式是通过价格在图表中形成的图形模型。 根据其中一项技术分析规定,历史(价格变动)重演。 这意味着价格变动在相同的情况下通常是相似的,这使得有可能以高概率预测情况的进一步发展。
InstaTrade的相关模式是一款易于使用的服务,可让您了解市场的最新变化并及时对市场线索做出反应。 在我们的服务中,您始终可以在任何货币对以及任何时间范围内找到最新和最相关的模式。
Double Bottom
was formed on 24.04 at 00:30:30 (UTC+0)
signal strength 3 of 5
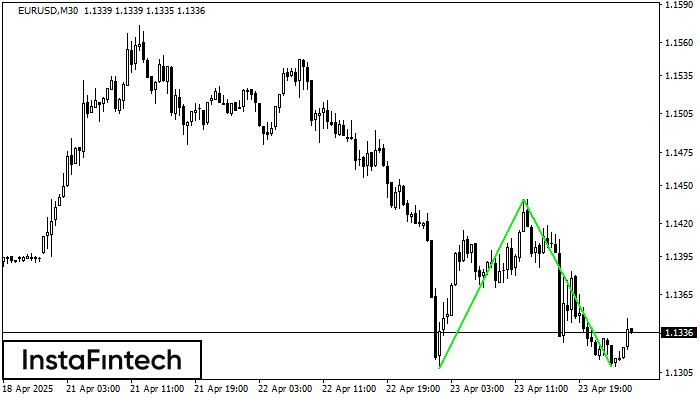
The Double Bottom pattern has been formed on EURUSD M30; the upper boundary is 1.1439; the lower boundary is 1.1310. The width of the pattern is 131 points. In case of a break of the upper boundary 1.1439, a change in the trend can be predicted where the width of the pattern will coincide with the distance to a possible take profit level.
See Also
- All
- All
- Bearish Rectangle
- Bearish Symmetrical Triangle
- Bearish Symmetrical Triangle
- Bullish Rectangle
- Double Top
- Double Top
- Triple Bottom
- Triple Bottom
- Triple Top
- Triple Top
- All
- All
- Buy
- Sale
- All
- 1
- 2
- 3
- 4
- 5
Persegi Bullish
was formed on 11.05 at 01:12:20 (UTC+0)
signal strength 1 of 5

Menurut grafik dari M5, #Bitcoin terbentuk Persegi Bullish. Pola menunjukkan kelanjutan tren. Batas atas adalah 103800.29, batas lebih rendah adalah 103508.08. Sinyal berarti posisi beli harus dibuka diatas batas atas
Rangka waktu M5 dan M15 mungkin memiliki lebih dari titik entri yang keliru.
Open chart in a new window
Teratas Ganda
was formed on 11.05 at 00:45:18 (UTC+0)
signal strength 1 of 5

Pada grafik #Bitcoin M5 pola reversal Teratas Ganda telah terbentuk. Karakteristik: batas atas 103800.29; batas bawah 103508.08; lebar pola 29221 poin. Sinyal: tembusan ke batas bawah akan menyebabkan kelanjutan tren
Rangka waktu M5 dan M15 mungkin memiliki lebih dari titik entri yang keliru.
Open chart in a new window
Persegi Bullish
was formed on 09.05 at 22:57:29 (UTC+0)
signal strength 1 of 5

Menurut grafik dari M5, GBPJPY terbentuk Persegi Bullish. Pola menunjukkan kelanjutan tren. Batas atas adalah 193.44, batas lebih rendah adalah 193.24. Sinyal berarti posisi beli harus dibuka diatas batas atas
Rangka waktu M5 dan M15 mungkin memiliki lebih dari titik entri yang keliru.
Open chart in a new window


