

实际模式

模式是通过价格在图表中形成的图形模型。 根据其中一项技术分析规定,历史(价格变动)重演。 这意味着价格变动在相同的情况下通常是相似的,这使得有可能以高概率预测情况的进一步发展。
InstaTrade的相关模式是一款易于使用的服务,可让您了解市场的最新变化并及时对市场线索做出反应。 在我们的服务中,您始终可以在任何货币对以及任何时间范围内找到最新和最相关的模式。
Bearish Rectangle
was formed on 16.04 at 01:07:48 (UTC+0)
signal strength 1 of 5
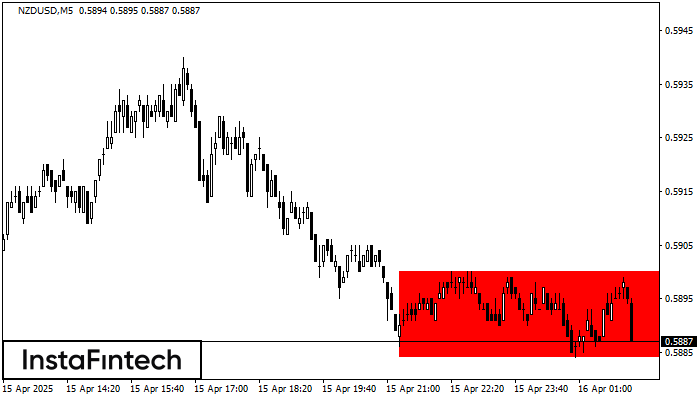
According to the chart of M5, NZDUSD formed the Bearish Rectangle. The pattern indicates a trend continuation. The upper border is 0.5900, the lower border is 0.5884. The signal means that a short position should be opened after fixing a price below the lower border 0.5884 of the Bearish Rectangle.
The M5 and M15 time frames may have more false entry points.
See Also
- All
- All
- Bearish Rectangle
- Bearish Symmetrical Triangle
- Bearish Symmetrical Triangle
- Bullish Rectangle
- Double Top
- Double Top
- Triple Bottom
- Triple Bottom
- Triple Top
- Triple Top
- All
- All
- Buy
- Sale
- All
- 1
- 2
- 3
- 4
- 5
Head dan Shoulders
was formed on 05.06 at 04:45:35 (UTC+0)
signal strength 1 of 5
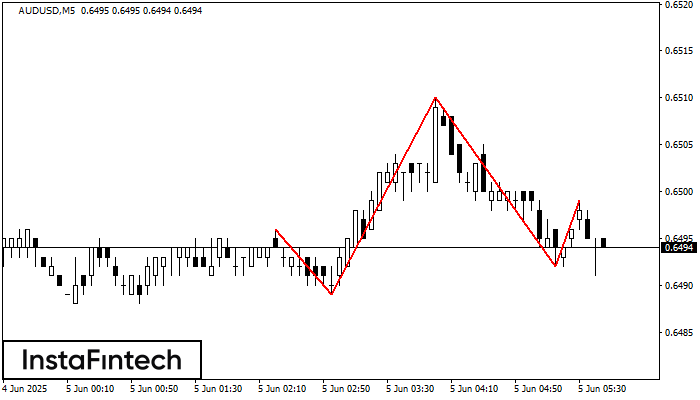
Corak teknikal yang dipanggil Head dan Shoulders telah muncul pada carta AUDUSD M5. Terdapat alasan yang berat untuk menunjukkan bahawa harga akan mengatasi garisan Neck 0.6489/0.6492 selepas Shoulder kanan telah
Carta masa M5 dan M15 mungkin mempunyai lebih banyak titik kemasukan palsu.
Open chart in a new window
Segi Empat Menurun
was formed on 05.06 at 04:06:17 (UTC+0)
signal strength 2 of 5

Berdasarkan carta M15, EURCHF telah membentuk Segi Empat Menurun. Corak ini menunjukkan kesinambungan aliran. Sempadan atas adalah 0.9348, sempadan bawah adalah 0.9337. Isyarat bermakna bahawa kedudukan pendek perlu dibuka selepas
Carta masa M5 dan M15 mungkin mempunyai lebih banyak titik kemasukan palsu.
Open chart in a new window
Double Top
was formed on 05.06 at 04:00:46 (UTC+0)
signal strength 3 of 5
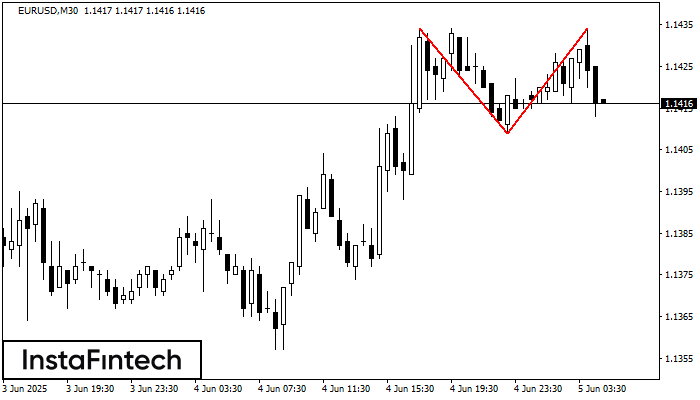
Corak Double Top telah dibentuk pada EURUSD M30. Isyarat bahawa aliran telah berubah dari aliran menaik ke aliran menurun. Mungkin, sekiranya asas corak 1.1409 ditembusi, pergerakan menurun akan berterusan
Open chart in a new window


