

实际模式

模式是通过价格在图表中形成的图形模型。 根据其中一项技术分析规定,历史(价格变动)重演。 这意味着价格变动在相同的情况下通常是相似的,这使得有可能以高概率预测情况的进一步发展。
InstaTrade的相关模式是一款易于使用的服务,可让您了解市场的最新变化并及时对市场线索做出反应。 在我们的服务中,您始终可以在任何货币对以及任何时间范围内找到最新和最相关的模式。
Bullish pennant
was formed on 14.04 at 20:17:04 (UTC+0)
signal strength 1 of 5
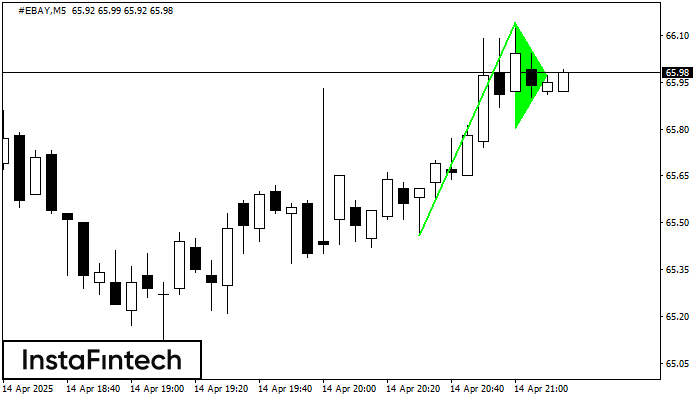
The Bullish pennant pattern is formed on the #EBAY M5 chart. It is a type of the continuation pattern. Supposedly, in case the price is fixed above the pennant’s high of 66.14, a further uptrend is possible.
The M5 and M15 time frames may have more false entry points.
See Also
- All
- All
- Bearish Rectangle
- Bearish Symmetrical Triangle
- Bearish Symmetrical Triangle
- Bullish Rectangle
- Double Top
- Double Top
- Triple Bottom
- Triple Bottom
- Triple Top
- Triple Top
- All
- All
- Buy
- Sale
- All
- 1
- 2
- 3
- 4
- 5
Бычий вымпел
сформирован 02.06 в 17:13:01 (UTC+0)
сила сигнала 1 из 5
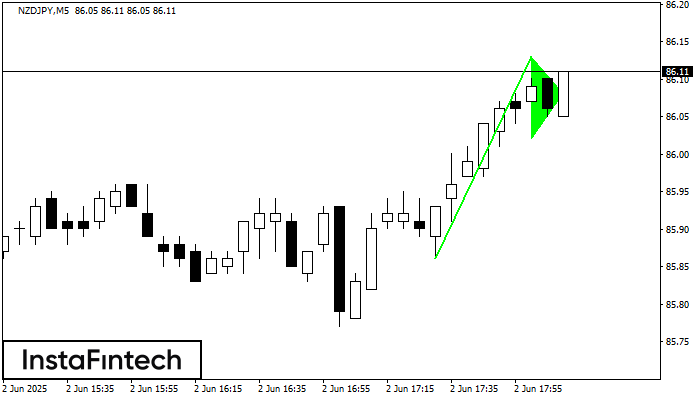
Графическая фигура «Бычий вымпел» сформировалась по инструменту NZDJPY на M5. Данный вид фигуры относится к типу продолжения тенденции. В случае если котировке удастся преодолеть максимум вымпела 86.13, то ожидается продолжение
Таймфреймы М5 и М15 могут иметь больше ложных точек входа.
Открыть график инструмента в новом окне
Бычий симметричный треугольник
сформирован 02.06 в 16:53:37 (UTC+0)
сила сигнала 5 из 5
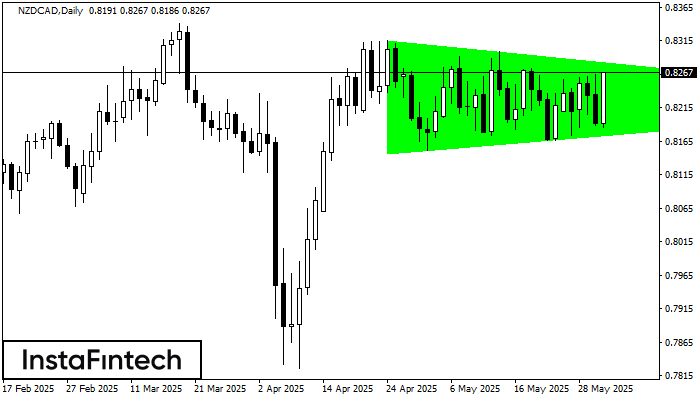
По NZDCAD на D1 сформировалась фигура «Бычий симметричный треугольник». Нижняя граница фигуры имеет координаты 0.8146/0.8223, при этом верхняя граница 0.8316/0.8223. Формирование фигуры «Бычий симметричный треугольник» наиболее вероятным образом свидетельствует
Открыть график инструмента в новом окне
Прямоугольник
сформирован 02.06 в 16:03:51 (UTC+0)
сила сигнала 5 из 5
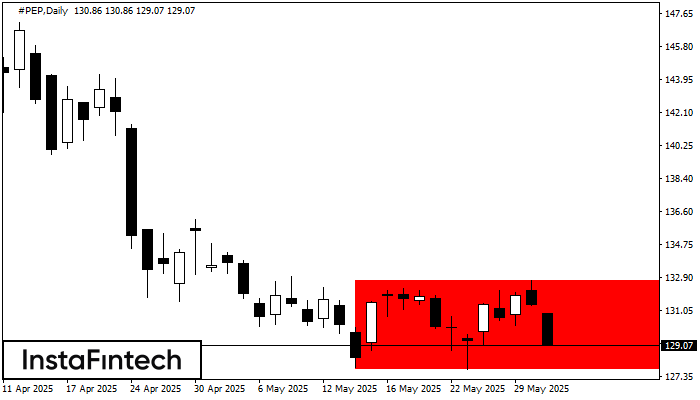
По #PEP D1 сформировалась фигура - «Прямоугольник». Фигура данного типа относится к тому типу продолжения тренда, который имеет два уровня: Сопротивление 132.70; Поддержка 127.74. В случае пробоя уровня поддержки 127.74
Открыть график инструмента в новом окне


