

实际模式

模式是通过价格在图表中形成的图形模型。 根据其中一项技术分析规定,历史(价格变动)重演。 这意味着价格变动在相同的情况下通常是相似的,这使得有可能以高概率预测情况的进一步发展。
InstaTrade的相关模式是一款易于使用的服务,可让您了解市场的最新变化并及时对市场线索做出反应。 在我们的服务中,您始终可以在任何货币对以及任何时间范围内找到最新和最相关的模式。
Double Bottom
was formed on 14.04 at 20:00:18 (UTC+0)
signal strength 2 of 5
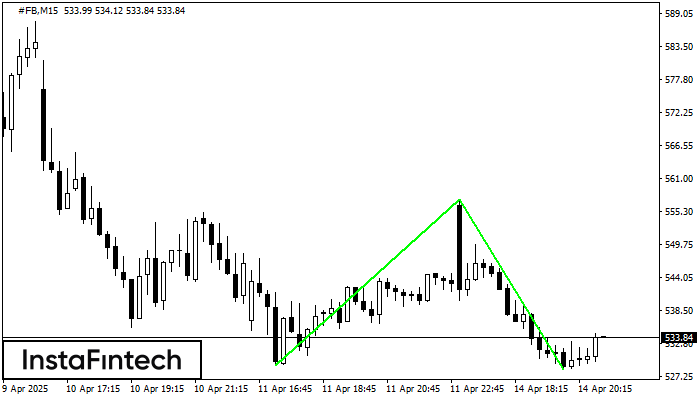
The Double Bottom pattern has been formed on #FB M15. Characteristics: the support level 529.17; the resistance level 557.42; the width of the pattern 2825 points. If the resistance level is broken, a change in the trend can be predicted with the first target point lying at the distance of 2905 points.
The M5 and M15 time frames may have more false entry points.
- All
- All
- Bearish Rectangle
- Bearish Symmetrical Triangle
- Bearish Symmetrical Triangle
- Bullish Rectangle
- Double Top
- Double Top
- Triple Bottom
- Triple Bottom
- Triple Top
- Triple Top
- All
- All
- Buy
- Sale
- All
- 1
- 2
- 3
- 4
- 5
Double Bottom
was formed on 30.05 at 20:46:52 (UTC+0)
signal strength 2 of 5
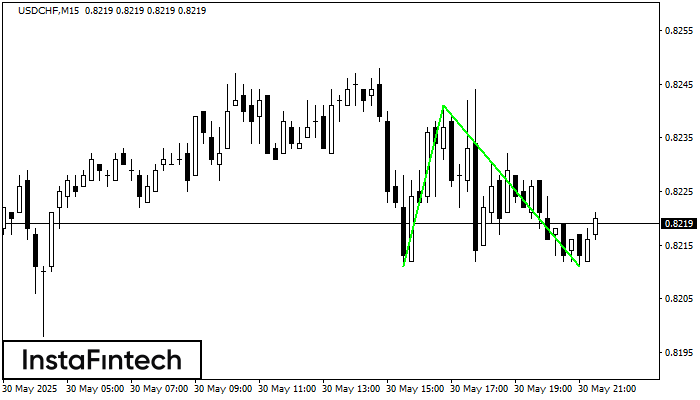
Corak Double Bottom telah dibentuk pada USDCHF M15. Ciri-ciri: tahap sokongan 0.8211; tahap rintangan 0.8241; lebar corak 30 mata. Sekiranya tahap rintangan ditembusi, perubahan aliran boleh diramalkan dengan titik sasaran
Carta masa M5 dan M15 mungkin mempunyai lebih banyak titik kemasukan palsu.
Open chart in a new window
Triple Bottom
was formed on 30.05 at 20:25:24 (UTC+0)
signal strength 1 of 5
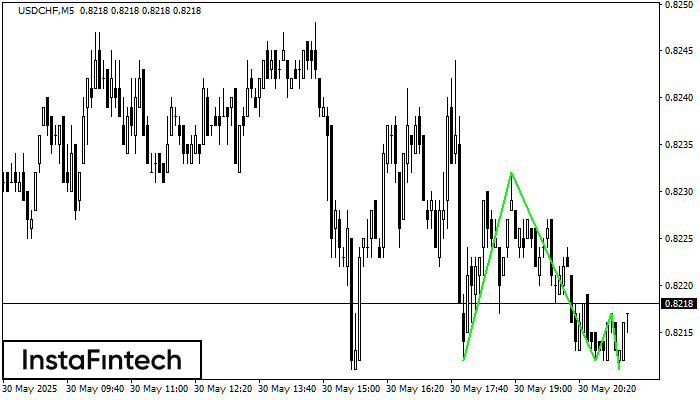
Corak Triple Bottom telah dibentuk pada carta bagi instrumen dagangan USDCHF M5. Corak menandakan perubahan aliran dari menurun ke aliran menaik dalam sekiranya penembusan 0.8232/0.8217
Carta masa M5 dan M15 mungkin mempunyai lebih banyak titik kemasukan palsu.
Open chart in a new window
Double Bottom
was formed on 30.05 at 20:10:20 (UTC+0)
signal strength 1 of 5
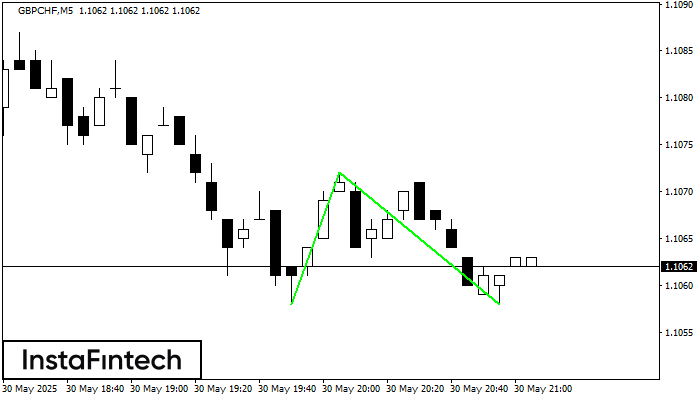
Corak Double Bottom telah dibentuk pada GBPCHF M5. Pembentukan ini menandakan pembalikan aliran dari aliran menurun ke atas. Isyarat ialah perdagangan membeli harus dibuka selepas sempadan atas corak 1.1072 telah
Carta masa M5 dan M15 mungkin mempunyai lebih banyak titik kemasukan palsu.
Open chart in a new window


