

实际模式

模式是通过价格在图表中形成的图形模型。 根据其中一项技术分析规定,历史(价格变动)重演。 这意味着价格变动在相同的情况下通常是相似的,这使得有可能以高概率预测情况的进一步发展。
InstaTrade的相关模式是一款易于使用的服务,可让您了解市场的最新变化并及时对市场线索做出反应。 在我们的服务中,您始终可以在任何货币对以及任何时间范围内找到最新和最相关的模式。
Double Bottom
was formed on 10.04 at 12:50:19 (UTC+0)
signal strength 1 of 5
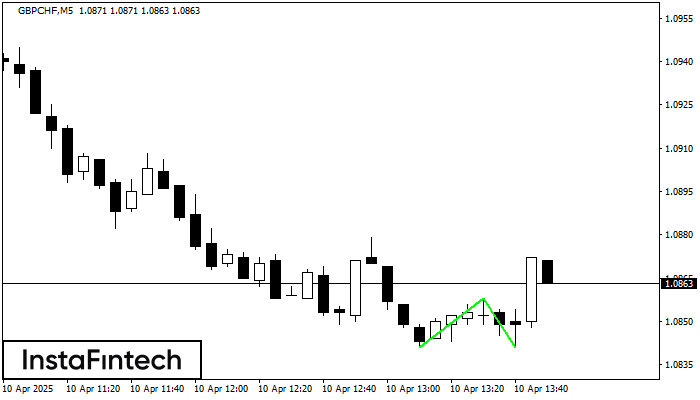
The Double Bottom pattern has been formed on GBPCHF M5. This formation signals a reversal of the trend from downwards to upwards. The signal is that a buy trade should be opened after the upper boundary of the pattern 1.0858 is broken. The further movements will rely on the width of the current pattern 17 points.
The M5 and M15 time frames may have more false entry points.
See Also
- All
- All
- Bearish Rectangle
- Bearish Symmetrical Triangle
- Bearish Symmetrical Triangle
- Bullish Rectangle
- Double Top
- Double Top
- Triple Bottom
- Triple Bottom
- Triple Top
- Triple Top
- All
- All
- Buy
- Sale
- All
- 1
- 2
- 3
- 4
- 5
Тройное дно
сформирован 25.05 в 15:59:45 (UTC+0)
сила сигнала 4 из 5

Сформирована фигура «Тройное дно» по торговому инструменту #Bitcoin на H1. Фигура сигнализирует об изменении тенденции с нисходящей на восходящую в случае пробоя верхней границы 108246.73
Открыть график инструмента в новом окне
Двойное дно
сформирован 25.05 в 12:20:13 (UTC+0)
сила сигнала 1 из 5

Сформирована фигура «Двойное дно» на графике #Bitcoin M5. Характеристика: Уровень поддержки 106888.42; Уровень сопротивления 107214.56; Ширина фигуры 32614 пунктов. В случае пробоя уровня сопротивления можно будет прогнозировать изменение тенденции
Таймфреймы М5 и М15 могут иметь больше ложных точек входа.
Открыть график инструмента в новом окне
Прямоугольник
сформирован 25.05 в 07:55:30 (UTC+0)
сила сигнала 1 из 5

По торговому инструменту #Bitcoin на M5 сформировалась фигура продолжения тренда - «Прямоугольник». Фигура имеет границы: Нижняя 107891.05; Верхняя 108246.73. В случае пробоя верхней границы вероятно дальнейшее движение в сторону тренда
Таймфреймы М5 и М15 могут иметь больше ложных точек входа.
Открыть график инструмента в новом окне


