

实际模式

模式是通过价格在图表中形成的图形模型。 根据其中一项技术分析规定,历史(价格变动)重演。 这意味着价格变动在相同的情况下通常是相似的,这使得有可能以高概率预测情况的进一步发展。
InstaTrade的相关模式是一款易于使用的服务,可让您了解市场的最新变化并及时对市场线索做出反应。 在我们的服务中,您始终可以在任何货币对以及任何时间范围内找到最新和最相关的模式。
Double Bottom
was formed on 10.04 at 11:25:22 (UTC+0)
signal strength 1 of 5
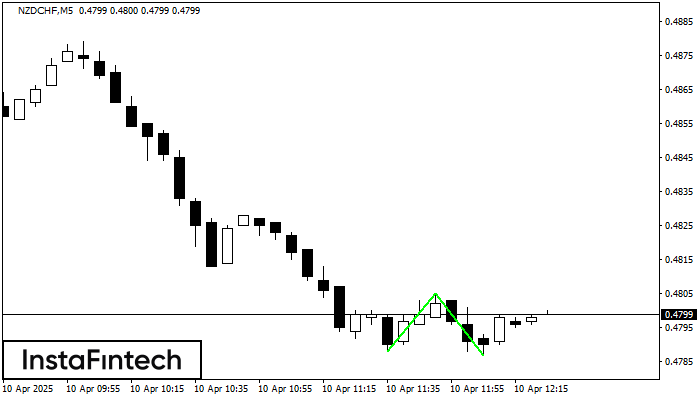
The Double Bottom pattern has been formed on NZDCHF M5. Characteristics: the support level 0.4788; the resistance level 0.4805; the width of the pattern 17 points. If the resistance level is broken, a change in the trend can be predicted with the first target point lying at the distance of 18 points.
The M5 and M15 time frames may have more false entry points.
- All
- All
- Bearish Rectangle
- Bearish Symmetrical Triangle
- Bearish Symmetrical Triangle
- Bullish Rectangle
- Double Top
- Double Top
- Triple Bottom
- Triple Bottom
- Triple Top
- Triple Top
- All
- All
- Buy
- Sale
- All
- 1
- 2
- 3
- 4
- 5
Triángulo Simétrico Alcista
was formed on 22.05 at 03:55:35 (UTC+0)
signal strength 1 of 5
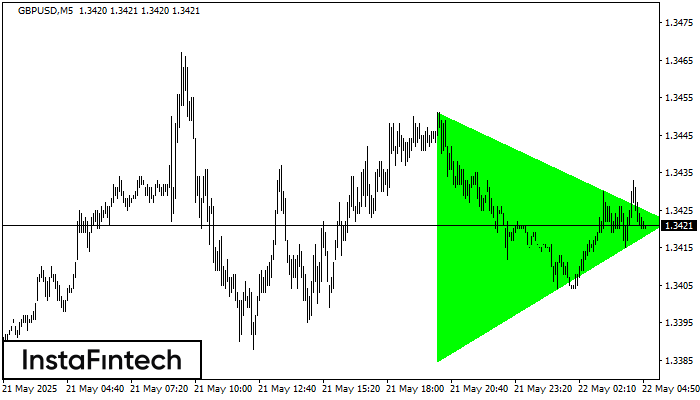
Según el gráfico de M5, GBPUSD formó el patrón Triángulo Simétrico Alcista. Descripción: Este es el patrón de la continuación de una tendencia. 1.3451 y 1.3385 son las coordenadas
Los marcos de tiempo M5 y M15 pueden tener más puntos de entrada falsos.
Open chart in a new window
Triángulo Simétrico Bajista
was formed on 22.05 at 03:43:04 (UTC+0)
signal strength 1 of 5
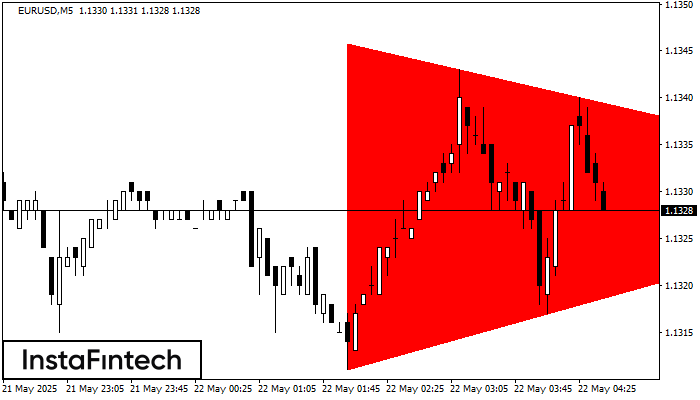
Según el gráfico de M5, el EURUSD formó el patrón Triángulo Simétrico Bajista. Este patrón señala una tendencia bajista en caso de que el límite inferior 1.1311 sea roto. Aquí
Los marcos de tiempo M5 y M15 pueden tener más puntos de entrada falsos.
Open chart in a new window
Doble Piso
was formed on 22.05 at 03:15:53 (UTC+0)
signal strength 2 of 5
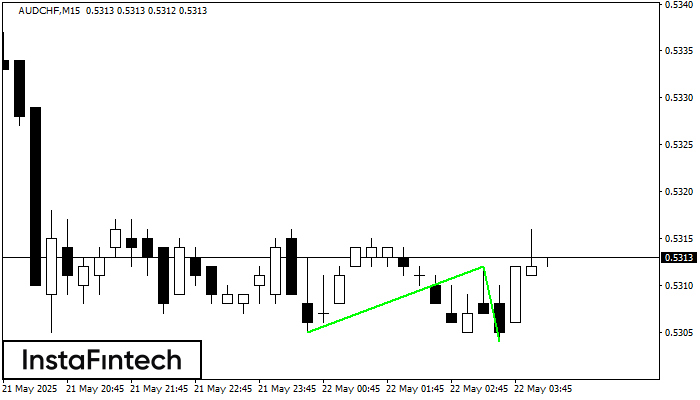
El patrón Doble Piso ha sido formado en AUDCHF M15; el límite superior es 0.5312; el límite inferior es 0.5304. El ancho del patrón es 7 puntos. En caso
Los marcos de tiempo M5 y M15 pueden tener más puntos de entrada falsos.
Open chart in a new window


