

实际模式

模式是通过价格在图表中形成的图形模型。 根据其中一项技术分析规定,历史(价格变动)重演。 这意味着价格变动在相同的情况下通常是相似的,这使得有可能以高概率预测情况的进一步发展。
InstaTrade的相关模式是一款易于使用的服务,可让您了解市场的最新变化并及时对市场线索做出反应。 在我们的服务中,您始终可以在任何货币对以及任何时间范围内找到最新和最相关的模式。
Bullish Symmetrical Triangle
was formed on 09.04 at 23:31:08 (UTC+0)
signal strength 1 of 5
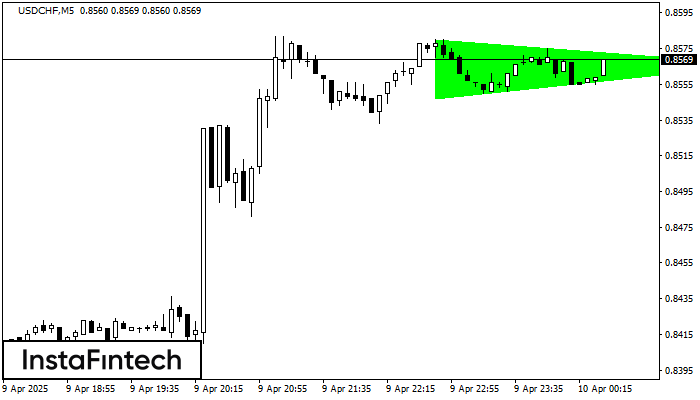
According to the chart of M5, USDCHF formed the Bullish Symmetrical Triangle pattern. Description: This is the pattern of a trend continuation. 0.8580 and 0.8547 are the coordinates of the upper and lower borders respectively. The pattern width is measured on the chart at 33 pips. Outlook: If the upper border 0.8580 is broken, the price is likely to continue its move by 0.8581.
The M5 and M15 time frames may have more false entry points.
See Also
- All
- All
- Bearish Rectangle
- Bearish Symmetrical Triangle
- Bearish Symmetrical Triangle
- Bullish Rectangle
- Double Top
- Double Top
- Triple Bottom
- Triple Bottom
- Triple Top
- Triple Top
- All
- All
- Buy
- Sale
- All
- 1
- 2
- 3
- 4
- 5
Тройная вершина
сформирован 30.05 в 22:20:23 (UTC+0)
сила сигнала 1 из 5

По GOLD на M5 сформировалась фигура «Тройная вершина». Характеристика: Границы имеют восходящий угол. Нижняя граница фигуры имеет координаты 3289.23/3291.16, при этом верхняя граница 3295.36/3295.32. Проекция ширины 613 пунктов. Формирование фигуры
Таймфреймы М5 и М15 могут иметь больше ложных точек входа.
Открыть график инструмента в новом окне
Перевернутая голова и плечи
сформирован 30.05 в 21:50:24 (UTC+0)
сила сигнала 1 из 5

По #AMZN на M5 сформировалась фигура «Перевернутая голова и плечи». Голова закреплена на 201.64, при этом средняя линия шеи расположена на 204.52/205.01. Формирование фигуры «Перевернутая голова и плечи» наиболее вероятным
Таймфреймы М5 и М15 могут иметь больше ложных точек входа.
Открыть график инструмента в новом окне
Прямоугольник
сформирован 30.05 в 21:36:36 (UTC+0)
сила сигнала 1 из 5

По торговому инструменту GBPAUD на M5 сформировалась фигура продолжения тренда - «Прямоугольник». Фигура имеет границы: Нижняя 2.0897; Верхняя 2.0908. В случае пробоя нижней границы вероятно дальнейшее движение в сторону тренда
Таймфреймы М5 и М15 могут иметь больше ложных точек входа.
Открыть график инструмента в новом окне


