

实际模式

模式是通过价格在图表中形成的图形模型。 根据其中一项技术分析规定,历史(价格变动)重演。 这意味着价格变动在相同的情况下通常是相似的,这使得有可能以高概率预测情况的进一步发展。
InstaTrade的相关模式是一款易于使用的服务,可让您了解市场的最新变化并及时对市场线索做出反应。 在我们的服务中,您始终可以在任何货币对以及任何时间范围内找到最新和最相关的模式。
Double Top
was formed on 08.04 at 18:20:17 (UTC+0)
signal strength 1 of 5

The Double Top reversal pattern has been formed on #KO M5. Characteristics: the upper boundary 69.94; the lower boundary 69.49; the width of the pattern is 50 points. Sell trades are better to be opened below the lower boundary 69.49 with a possible movements towards the 69.34 level.
The M5 and M15 time frames may have more false entry points.
- All
- All
- Bearish Rectangle
- Bearish Symmetrical Triangle
- Bearish Symmetrical Triangle
- Bullish Rectangle
- Double Top
- Double Top
- Triple Bottom
- Triple Bottom
- Triple Top
- Triple Top
- All
- All
- Buy
- Sale
- All
- 1
- 2
- 3
- 4
- 5
Persegi Bullish
was formed on 29.05 at 23:04:26 (UTC+0)
signal strength 5 of 5
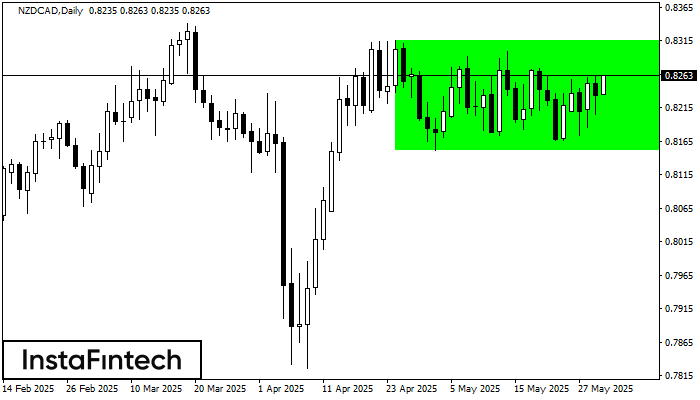
Menurut grafik dari D1, NZDCAD terbentuk Persegi Bullish. Pola menunjukkan kelanjutan tren. Batas atas adalah 0.8316, batas lebih rendah adalah 0.8151. Sinyal berarti posisi beli harus dibuka diatas batas atas
Open chart in a new window
Segitiga Simetris Bearish
was formed on 29.05 at 22:19:03 (UTC+0)
signal strength 1 of 5
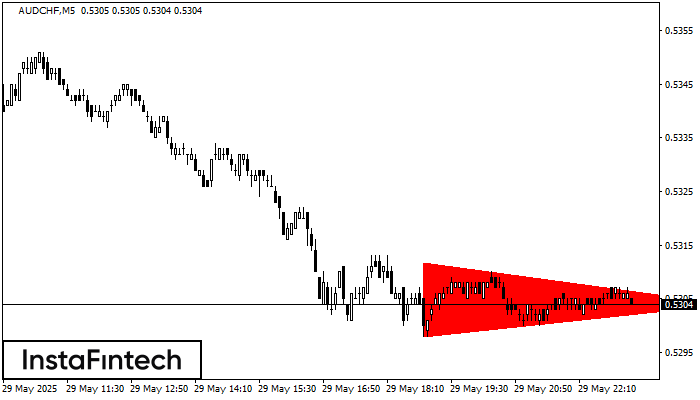
Menurut Grafik dari M5, AUDCHF dibentuk pola Segitiga Simetris Bearish. Rekomendasi Trading: Penembusan dari batas yang lebih rendah 0.5298 kemungkinan akan mendorong kelanjutan dari tren penurunan
Rangka waktu M5 dan M15 mungkin memiliki lebih dari titik entri yang keliru.
Open chart in a new window
Bendera Bullish
was formed on 29.05 at 22:16:27 (UTC+0)
signal strength 3 of 5
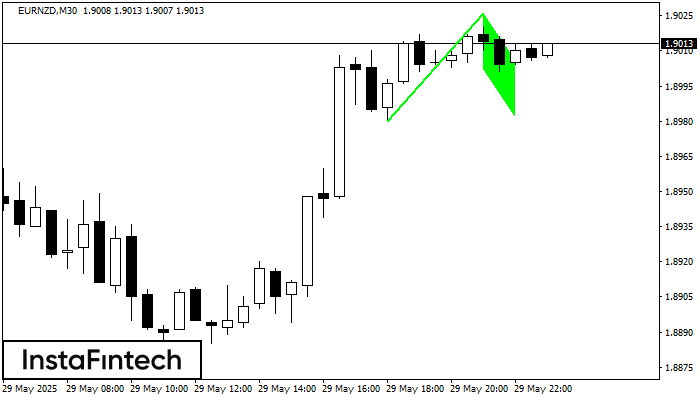
Pola Bendera Bullish yang memberikan sinyal kelanjutan tren telah terbentuk di grafik EURNZD M30. Prakiraan: jika harga menembus ke atas titik tertinggi harga di 1.9026, maka para trader akan dapat
Open chart in a new window


