

实际模式

模式是通过价格在图表中形成的图形模型。 根据其中一项技术分析规定,历史(价格变动)重演。 这意味着价格变动在相同的情况下通常是相似的,这使得有可能以高概率预测情况的进一步发展。
InstaTrade的相关模式是一款易于使用的服务,可让您了解市场的最新变化并及时对市场线索做出反应。 在我们的服务中,您始终可以在任何货币对以及任何时间范围内找到最新和最相关的模式。
Bearish Symmetrical Triangle
was formed on 08.04 at 12:30:45 (UTC+0)
signal strength 4 of 5
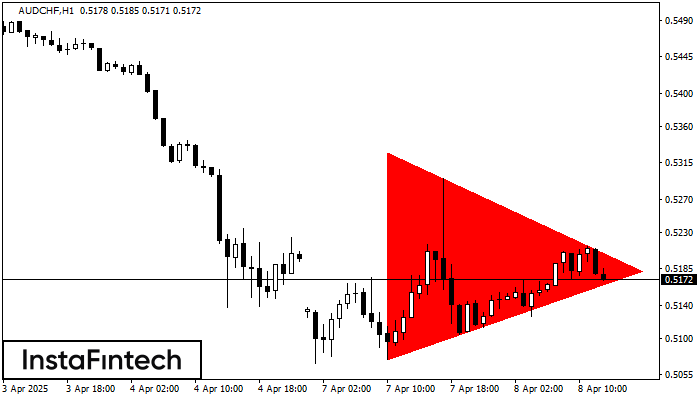
According to the chart of H1, AUDCHF formed the Bearish Symmetrical Triangle pattern. Description: The lower border is 0.5074/0.5182 and upper border is 0.5328/0.5182. The pattern width is measured on the chart at -254 pips. The formation of the Bearish Symmetrical Triangle pattern evidently signals a continuation of the downward trend. In other words, if the scenario comes true and AUDCHF breaches the lower border, the price could continue its move toward 0.5142.
- All
- All
- Bearish Rectangle
- Bearish Symmetrical Triangle
- Bearish Symmetrical Triangle
- Bullish Rectangle
- Double Top
- Double Top
- Triple Bottom
- Triple Bottom
- Triple Top
- Triple Top
- All
- All
- Buy
- Sale
- All
- 1
- 2
- 3
- 4
- 5
Double Top
was formed on 23.04 at 16:54:48 (UTC+0)
signal strength 1 of 5
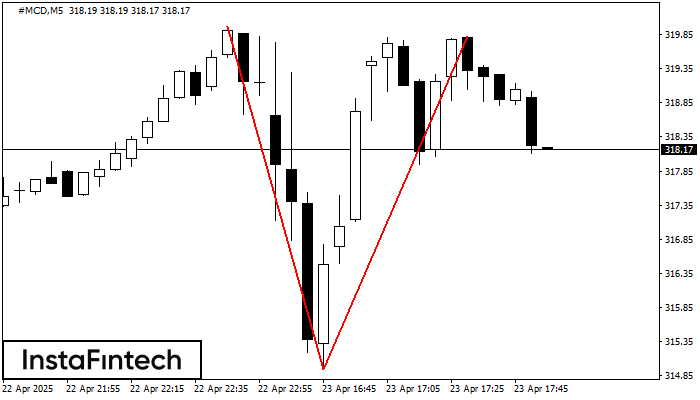
Corak pembalikan Double Top telah dibentuk pada #MCD M5. Ciri-ciri: sempadan atas %P0.000000; sempadan bawah 319.97; sempadan bawah 314.94; lebar corak adalah 488 mata. Dagangan menjual adalah lebih baik untuk
Carta masa M5 dan M15 mungkin mempunyai lebih banyak titik kemasukan palsu.
Open chart in a new window
Segi Empat Menaik
was formed on 23.04 at 16:30:47 (UTC+0)
signal strength 1 of 5
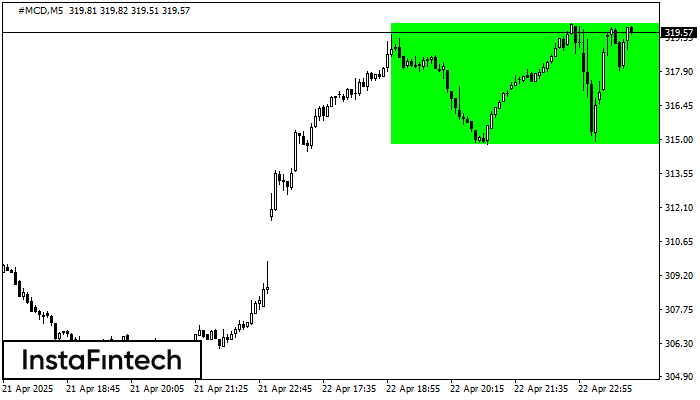
Berdasarkan carta M5, #MCD telah membentuk Segi Empat Menaik. Corak ini menunjukkan kesinambungan aliran. Sempadan atas adalah 319.97, sempadan bawah adalah 314.80. Isyarat bermakna bahawa kedudukan panjang perlu dibuka
Carta masa M5 dan M15 mungkin mempunyai lebih banyak titik kemasukan palsu.
Open chart in a new window
Segi Empat Menaik
was formed on 23.04 at 16:29:55 (UTC+0)
signal strength 2 of 5
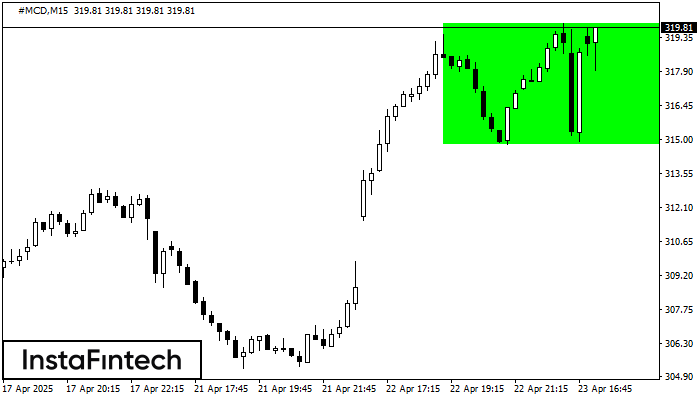
Berdasarkan carta M15, #MCD telah membentuk Segi Empat Menaik. Corak ini menunjukkan kesinambungan aliran. Sempadan atas adalah 319.97, sempadan bawah adalah 314.80. Isyarat bermakna bahawa kedudukan panjang perlu dibuka
Carta masa M5 dan M15 mungkin mempunyai lebih banyak titik kemasukan palsu.
Open chart in a new window


