

实际模式

模式是通过价格在图表中形成的图形模型。 根据其中一项技术分析规定,历史(价格变动)重演。 这意味着价格变动在相同的情况下通常是相似的,这使得有可能以高概率预测情况的进一步发展。
InstaTrade的相关模式是一款易于使用的服务,可让您了解市场的最新变化并及时对市场线索做出反应。 在我们的服务中,您始终可以在任何货币对以及任何时间范围内找到最新和最相关的模式。
Triple Bottom
was formed on 03.04 at 04:50:12 (UTC+0)
signal strength 1 of 5
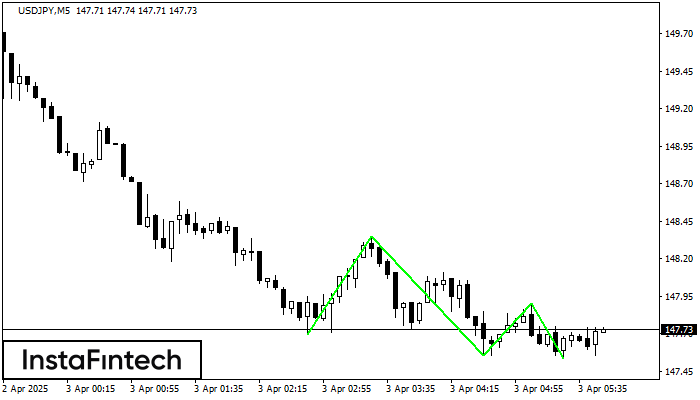
The Triple Bottom pattern has formed on the chart of USDJPY M5. Features of the pattern: The lower line of the pattern has coordinates 148.35 with the upper limit 148.35/147.90, the projection of the width is 65 points. The formation of the Triple Bottom pattern most likely indicates a change in the trend from downward to upward. This means that in the event of a breakdown of the resistance level 147.70, the price is most likely to continue the upward movement.
The M5 and M15 time frames may have more false entry points.
- All
- All
- Bearish Rectangle
- Bearish Symmetrical Triangle
- Bearish Symmetrical Triangle
- Bullish Rectangle
- Double Top
- Double Top
- Triple Bottom
- Triple Bottom
- Triple Top
- Triple Top
- All
- All
- Buy
- Sale
- All
- 1
- 2
- 3
- 4
- 5
Двойная вершина
сформирован 06.06 в 22:30:10 (UTC+0)
сила сигнала 2 из 5

На торговом графике USDCAD M15 сформировалась разворотная фигура «Двойная вершина». Характеристика: Верхняя граница 1.3702; Нижняя граница 1.3668; Ширина фигуры 34 пунктов. Сигнал: Пробой нижней границы 1.3668 приведет к дальнейшему нисходящему
Таймфреймы М5 и М15 могут иметь больше ложных точек входа.
Открыть график инструмента в новом окне
Бычий симметричный треугольник
сформирован 06.06 в 22:18:11 (UTC+0)
сила сигнала 2 из 5

По AUDJPY на M15 сформировалась фигура «Бычий симметричный треугольник». Нижняя граница фигуры имеет координаты 93.96/94.02, при этом верхняя граница 94.07/94.02. Формирование фигуры «Бычий симметричный треугольник» наиболее вероятным образом свидетельствует
Таймфреймы М5 и М15 могут иметь больше ложных точек входа.
Открыть график инструмента в новом окне
Тройное дно
сформирован 06.06 в 22:01:08 (UTC+0)
сила сигнала 3 из 5

Сформирована фигура «Тройное дно» по торговому инструменту GBPAUD на M30. Фигура сигнализирует об изменении тенденции с нисходящей на восходящую в случае пробоя верхней границы 2.0852
Открыть график инструмента в новом окне


