

实际模式

模式是通过价格在图表中形成的图形模型。 根据其中一项技术分析规定,历史(价格变动)重演。 这意味着价格变动在相同的情况下通常是相似的,这使得有可能以高概率预测情况的进一步发展。
InstaTrade的相关模式是一款易于使用的服务,可让您了解市场的最新变化并及时对市场线索做出反应。 在我们的服务中,您始终可以在任何货币对以及任何时间范围内找到最新和最相关的模式。
Bullish Rectangle
was formed on 02.04 at 15:25:46 (UTC+0)
signal strength 1 of 5
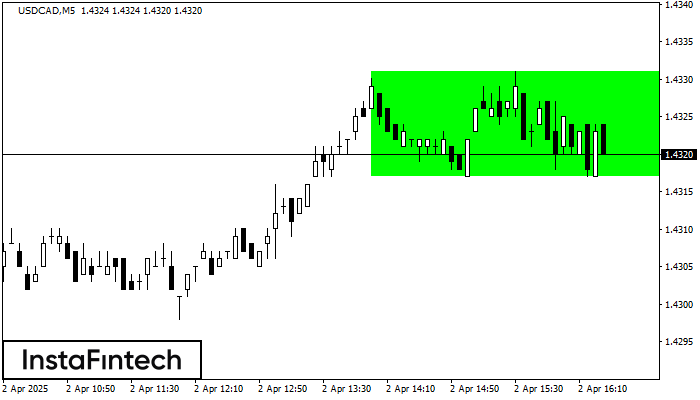
According to the chart of M5, USDCAD formed the Bullish Rectangle which is a pattern of a trend continuation. The pattern is contained within the following borders: the lower border 1.4317 – 1.4317 and upper border 1.4331 – 1.4331. In case the upper border is broken, the instrument is likely to follow the upward trend.
The M5 and M15 time frames may have more false entry points.
See Also
- All
- All
- Bearish Rectangle
- Bearish Symmetrical Triangle
- Bearish Symmetrical Triangle
- Bullish Rectangle
- Double Top
- Double Top
- Triple Bottom
- Triple Bottom
- Triple Top
- Triple Top
- All
- All
- Buy
- Sale
- All
- 1
- 2
- 3
- 4
- 5
Đỉnh ba
was formed on 01.06 at 02:15:04 (UTC+0)
signal strength 2 of 5

Trên biểu đồ của công cụ giao dịch #Bitcoin M15, mô hình Đỉnh ba báo hiệu sự thay đổi xu hướng đã hình thành. Có thể sau khi hình thành
Khung thời gian M5 và M15 có thể có nhiều điểm vào lệnh sai hơn.
Open chart in a new window
Đỉnh đôi
was formed on 01.06 at 01:00:35 (UTC+0)
signal strength 3 of 5

Mô hình đảo chiều Đỉnh đôi đã được hình thành trên #Bitcoin M30. Đặc điểm: ranh giới trên 104800.13; ranh giới dưới 104215.56; chiều rộng của mô hình là 64024
Open chart in a new window
Hình chữ nhật tăng
was formed on 31.05 at 19:15:46 (UTC+0)
signal strength 1 of 5

Theo biểu đồ của M5, #Bitcoin đã hình thành Hình chữ nhật tăng, cái mà là mô hình của sự tiếp tục xu hướng. Mô hình này được chứa trong
Khung thời gian M5 và M15 có thể có nhiều điểm vào lệnh sai hơn.
Open chart in a new window


