

实际模式

模式是通过价格在图表中形成的图形模型。 根据其中一项技术分析规定,历史(价格变动)重演。 这意味着价格变动在相同的情况下通常是相似的,这使得有可能以高概率预测情况的进一步发展。
InstaTrade的相关模式是一款易于使用的服务,可让您了解市场的最新变化并及时对市场线索做出反应。 在我们的服务中,您始终可以在任何货币对以及任何时间范围内找到最新和最相关的模式。
Double Bottom
was formed on 26.03 at 21:30:27 (UTC+0)
signal strength 2 of 5
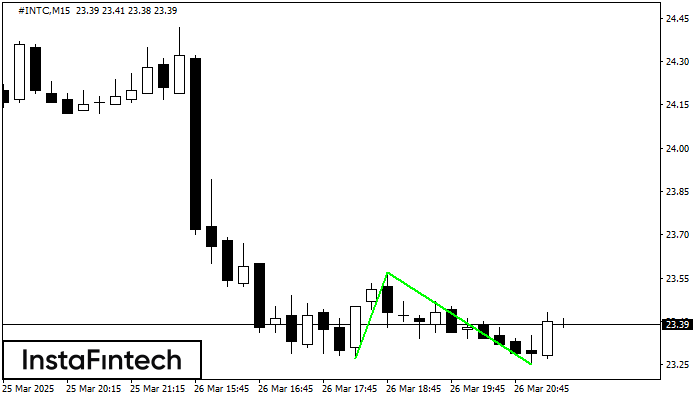
The Double Bottom pattern has been formed on #INTC M15. Characteristics: the support level 23.27; the resistance level 23.57; the width of the pattern 30 points. If the resistance level is broken, a change in the trend can be predicted with the first target point lying at the distance of 32 points.
The M5 and M15 time frames may have more false entry points.
See Also
- All
- All
- Bearish Rectangle
- Bearish Symmetrical Triangle
- Bearish Symmetrical Triangle
- Bullish Rectangle
- Double Top
- Double Top
- Triple Bottom
- Triple Bottom
- Triple Top
- Triple Top
- All
- All
- Buy
- Sale
- All
- 1
- 2
- 3
- 4
- 5
Persegi Bullish
was formed on 31.05 at 19:15:46 (UTC+0)
signal strength 1 of 5

Menurut grafik dari M5, #Bitcoin terbentuk Persegi Bullish yang merupakan pola dari kelanjutan tren. Pola terkandung dalam batas berikut: batas yang lebih rendah 104335.43 – 104335.43 dan batas atas 104800.13
Rangka waktu M5 dan M15 mungkin memiliki lebih dari titik entri yang keliru.
Open chart in a new window
Bawah Ganda
was formed on 31.05 at 13:20:01 (UTC+0)
signal strength 1 of 5

Pola Bawah Ganda telah terbentuk pada #Bitcoin M5. Karakteristik: level support 103250.25; level resistance 103385.09; lebar pola 13484 poin. Jika level resistance ditembus, perubahan dalam tren dapat diprediksi dengan target
Rangka waktu M5 dan M15 mungkin memiliki lebih dari titik entri yang keliru.
Open chart in a new window
Teratas Triple
was formed on 30.05 at 22:20:23 (UTC+0)
signal strength 1 of 5

Pola Teratas Triple telah terbentuk pada grafik instrumen trading GOLD M5. Pola tersebut merupakan pola reversal menampilkan karakteristik berikut: level resistance 4, levek support -193, dan lebar pola 613. Prakiraan
Rangka waktu M5 dan M15 mungkin memiliki lebih dari titik entri yang keliru.
Open chart in a new window


