

Financial markets move in cycles, driven by supply and demand, investor sentiment, and macroeconomic trends. Amid these fluctuations, patterns emerge that can reveal potential price reversals or continuations. One such phenomenon is divergence in trading, a powerful concept that helps traders anticipate shifts in momentum before they reflect in price action.
But before exploring how discrepancy works, it’s crucial to first establish what is trading. At its core, trading is the art of speculating on asset price movements, using historical data, technical indicators, market psychology to identify high-probability opportunities.
Why Divergence Matters in Market Analysis
Successful traders don’t just follow price movements — they analyze the underlying strength behind those moves. This is where momentum indicators like the Relative Strength Index (RSI), Moving Average Convergence Divergence (MACD) become invaluable. These tools measure whether an asset is overbought or oversold, providing insight into potential trend exhaustion or continuation.
When price trends upward, but a momentum indicator begins to decline, a contradiction forms. Similarly, if price trends downward while the indicator shows increasing strength, it signals a possible shift in sentiment. These deviations often serve as early warnings, giving traders an opportunity to prepare for trend changes before they happen.
How Traders Use Discrepancy to Predict Market Reversals
There are several ways to leverage this concept effectively:
- Spotting weakening trends – if a stock or currency pair is making higher highs but the RSI is failing to do the same, it suggests weakening bullish momentum.
- Confirming trend continuation – when price pulls back slightly but momentum indicators show continued strength, it reinforces the likelihood of trend continuation.
- Filtering out false signals – by using deviation in combination with support and resistance levels, candlestick formations, volume analysis, traders can avoid low-quality setups as well as focus on stronger opportunities.
Key Benefits of Recognizing Discrepancy Patterns
- Early market warnings – unlike many indicators that lag behind price movements, deviation often provides advance notice of potential reversals.
- Improved risk management – traders can set better stop-loss, take-profit levels by knowing whether a trend is weakening or gaining strength.
- Versatility across markets – this approach works in stocks, forex, commodities, cryptocurrencies, making it a valuable tool across different asset classes.
- Stronger trade entries and exits – rather than reacting to price action alone, traders can use divergence to fine-tune their decisions for better timing.
Why Every Trader Should Master This Concept
Deviation is more than just a pattern — it’s a window into the psychology of the market. When prices rise but momentum weakens, it often means that institutional investors are quietly offloading their positions while retail traders continue buying. On the flip side, when prices fall but momentum strengthens, it suggests that selling pressure is losing steam, creating a potential buying opportunity.
Unlike trend-following techniques that only confirm existing moves, discrepancy offers a predictive edge. Those who master this skill gain the ability to anticipate market movements before they happen, setting themselves apart from traders who react too late. By integrating deviation analysis into a broader technical framework, market participants can sharpen their decision-making, refine their entries and exits, build a more confident, strategic approach to market fluctuations.
What Is Divergence in Trading?
Market movements are rarely linear; they follow cycles of expansion and contraction, driven by institutional investors, retail participants, underlying economic forces. These fluctuations create patterns that provide insights into potential reversals or trend continuations. One of the most effective ways to detect hidden imbalances is through divergence in trading, a concept that reveals whether an asset’s momentum aligns with its price movement.
At its core, deviation occurs when price action moves in one direction, while momentum indicators suggest the opposite. This mismatch often signals that the prevailing trend is losing steam, offering traders an opportunity to adjust their positions before the broader market reacts. Recognizing these discrepancies can provide an edge, especially when combined with other forms of technical analysis.
How Market Imbalance Creates Discrepancy Patterns
Financial markets thrive on equilibrium — when buying and selling pressure are in sync, trends develop naturally. However, when price continues to climb while momentum indicators fail to confirm the move, or price declines while indicators show increasing strength, an imbalance emerges. These contradictions suggest that a trend may be nearing exhaustion or preparing for acceleration, depending on the type of pattern identified.
There are two primary types of deviation:
- Regular – typically suggests that a trend is weakening, could reverse soon.
- Hidden – often confirms the continuation of an existing trend, signaling that momentum is still intact.
Distinguishing between these variations allows traders to determine whether they should prepare for a market reversal or trust the current trend’s strength.
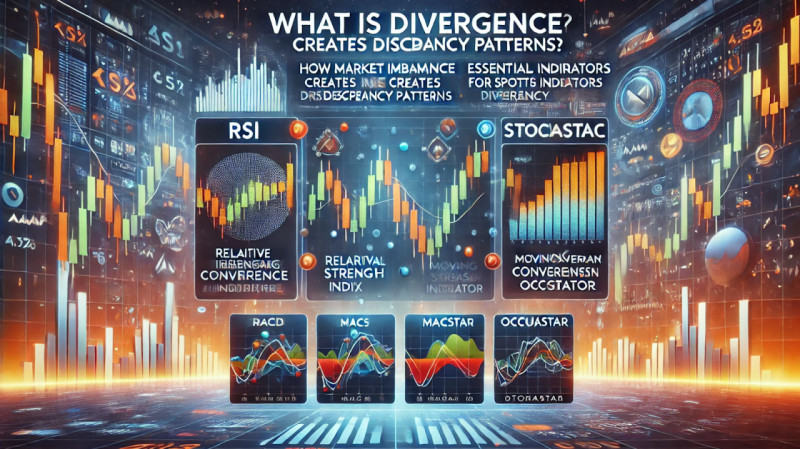
Essential Indicators for Spotting Market Discrepancies
Technical indicators play a crucial role in identifying deviation patterns. While numerous tools exist, momentum oscillators are particularly effective for this purpose. Below are the most widely used ones:
1. Relative Strength Index (RSI)
- Measures the speed, magnitude of recent price changes.
- An asset is considered overbought when RSI exceeds 70, oversold when it drops below 30.
- If price reaches new highs but RSI lags behind, bullish momentum is weakening.
- If price forms new lows but RSI shows higher lows, selling pressure is decreasing.
2. Moving Average Convergence Divergence (MACD)
- Compares short-term with long-term moving averages to assess momentum shifts.
- When price trends higher but the MACD histogram shows declining peaks, it indicates a loss of buying power.
- If price declines but the MACD line moves upward, bearish momentum is fading.
3. Stochastic Oscillator
- Determines whether an asset is overbought or oversold based on recent price ranges.
- Helps confirm trend exhaustion when combined with other technical tools.
- When price reaches higher highs but the Stochastic Oscillator forms lower highs, momentum is slowing down.
These indicators provide valuable clues, but using them in isolation can lead to false conclusions. Traders often combine them with price action analysis, support and resistance levels, volume indicators for confirmation.
Psychological and Market Forces Behind These Patterns
Price action is a reflection of collective market psychology. Every move is influenced by the emotions of buyers, sellers, ranging from fear and panic to greed and euphoria. When price climbs while indicators signal weakness, it often means that institutional traders are quietly offloading their positions while retail participants continue buying, unaware of the looming trend reversal.

Conversely, when price is in a downtrend but indicators start showing signs of strength, it suggests that sellers are losing control, buying pressure is building. The majority of market participants tend to react late, following price movements instead of anticipating them. Those who know what is divergence in trading, can spot these subtle shifts in momentum gain a significant advantage by positioning themselves ahead of the herd.
Discrepancy does not guarantee an immediate reversal but serves as a warning that sentiment is shifting. Knowing these dynamics enables traders to avoid impulsive decisions, refine their entry and exit points, minimize unnecessary risks. It also helps filter out false breakouts along with misleading trends, ensuring that decisions are based on underlying market strength rather than surface-level price action.
Applying Deviation Concepts Across Markets
This approach is not limited to a single asset class — it applies to stocks, forex, cryptocurrencies, commoditiesalike. Since all markets operate on supply and demand dynamics, momentum analysis remains universally relevant.
- In stock markets, discrepancy can reveal whether a rally is losing strength before a sell-off begins.
- In forex, it helps identify trend exhaustion in currency pairs before major reversals occur.
- In crypto, where volatility is extreme, momentum shifts often precede large price swings, making this tool particularly valuable.
- In commodities, it signals whether an uptrend or downtrend is sustainable based on underlying demand.
By mastering this concept, integrating it into a broader market approach, traders can move beyond reactive decision-making, develop a more structured, calculated way to approach price movements.
Types of Deviation in Trading
Momentum shifts in financial markets often provide clues about future price movements. While price action alone can be misleading, analyzing how it interacts with oscillators like the Relative Strength Index (RSI) or Moving Average Convergence Divergence (MACD) can uncover imbalances between buyers and sellers. Discrepancy occurs when price moves in one direction, but momentum indicators suggest a weakening or strengthening trend.

There are three primary types of deviation: regular, hidden, extended/exaggerated. Comprehending these variations is crucial for identifying trend reversals, confirming market strength, filtering out false breakouts.
Regular Discrepancy – Indicating Possible Reversals
When price as well as momentum indicators fail to align, it often signals a shift in trend direction. Regular deviation appears when price action reaches new highs or lows, but an oscillator fails to confirm the move. This type of pattern suggests that the prevailing trend is weakening, may be due for a reversal.
Bullish Regular Divergence (Potential Trend Reversal Upwards)
- Price forms lower lows, while the momentum indicator forms higher lows.
- Suggests that downward momentum is weakening, buyers may soon regain control.
- Often seen at the end of a downtrend before a significant upward move.
Bearish Regular Divergence (Potential Trend Reversal Downwards)
- Price makes higher highs, while the indicator forms lower highs.
- Indicates that bullish momentum is fading, sellers may take over.
- Frequently occurs at market tops before a decline begins.
Example in a Real Market Scenario:
A stock is in a prolonged downtrend, with price reaching new lows. However, the RSI refuses to follow, forming a rising trend despite lower price levels. Divergence in trading suggests that selling pressure is decreasing, an upside move could be imminent. On the flip side, if an asset continuously climbs but the MACD histogram begins to shrink, it signals that upward momentum is losing steam, warning of a potential downturn.
Hidden Deviation – Confirming Trend Continuation
Unlike regular discrepancy, which hints at reversals, hidden deviation strengthens existing trends by confirming momentum. This occurs when price retraces but an indicator shows a stronger movement in the direction of the main trend.
Bullish Hidden Divergence (Trend Resumption Upwards)
- Price forms higher lows, while the indicator forms lower lows.
- Suggests that despite a price pullback, buyers are still dominant.
- Often occurs in an uptrend before the continuation of bullish movement.
Bearish Hidden Divergence (Trend Resumption Downwards)
- Price makes lower highs, while the indicator forms higher highs.
- Confirms that sellers still have control despite short-term upward movements.
- Typically appears during a downtrend before another leg downward.
Why Hidden Discrepancy Matters
Many traders mistakenly assume that every deviation pattern suggests a reversal. Hidden discrepancy helps filter noise by reinforcing trend strength instead of signaling a complete shift in direction. This is particularly useful for identifying optimal entry points within established trends.
Extended and Exaggerated Divergence – Delayed Reactions
In some cases, price fails to react immediately to deviation patterns, causing extended or exaggerated variations. These setups often confuse traders because the expected reversal or continuation takes longer to materialize.
- Extended bullish discrepancy – price remains flat or slightly declines, but indicators form clear higher lows.
- Extended bearish deviation – price hovers at the same level or slightly rises, while indicators form lower highs.
Unlike standard discrepancy, which often leads to quick reactions, extended deviation can stretch over multiple timeframes, making it harder to time entries and exits. However, when price finally aligns with momentum indicators, the move tends to be more explosive.
Key Differences Between Regular, Hidden, Extended Divergence
| Type | Trend Type | Indicator Behavior | Market Implication |
| Regular | Reversal | Indicator moves opposite to price | Suggests weakening trend, potential shift |
| Hidden | Continuation | Indicator moves in the same direction as the trend | Confirms that the dominant trend remains intact |
| Extended | Delayed reversal or continuation | Price lags behind indicator movements | Market reacts slowly, requiring patience for confirmation |
Mastering these concepts allows traders to anticipate potential moves with greater accuracy, reducing the likelihood of being misled by false breakouts or short-term market noise.
Divergence and Convergence in Trading: Key Differences, Strategies
Momentum shifts in financial markets create opportunities for those who can interpret them correctly. While deviation helps detect early signs of trend reversals or continuations, convergence provides confirmation of existing price direction. Recognizing the distinction between these two concepts lets traders filter out misleading patterns, make more precise decisions.
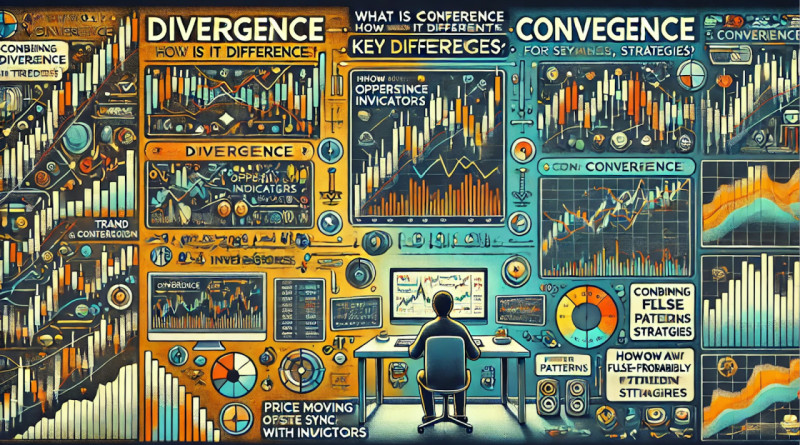
What Is Convergence, How Is It Different from Divergence?
Convergence occurs when both price action along with momentum indicators move in sync, reinforcing the strength of a trend. Unlike discrepancy in trading which highlights discrepancies between price and indicators, convergence validates the prevailing movement.
Key characteristics of convergence:
- Bullish convergence: price forms higher highs, momentum indicators follow the same path.
- Bearish convergence: price makes lower lows, technical indicators confirm the downward momentum.
In contrast, deviation suggests that price as well as momentum are not aligned, indicating potential market shifts.
| Concept | Price movement | Indicator movement | Market implication |
| Convergence | Higher highs/ Lower lows | Moves in the same direction | Confirms existing trend |
| Divergence | Higher highs/ Lower lows | Moves in the opposite direction | Signals weakening momentum, potential reversal |
How Convergence Confirms Market Trends
A strong trend backed by convergence has a higher likelihood of continuation. When price moves higher, indicators like MACD, RSI, or Stochastic Oscillator also show increasing momentum, suggesting that buyers remain in control. Similarly, during a downward move, if oscillators confirm falling momentum, it signals that sellers dominate.
Key applications of convergence:
- Enhancing trend-following approaches – by confirming that momentum supports price movement, traders can enter positions with increased confidence.
- Avoiding premature reversals – many traders get caught in false breakouts due to misleading discrepancy patterns. Convergence helps validate whether the trend remains strong.
- Filtering out weak setups – if a trend lacks convergence, it may be driven by short-term speculation rather than genuine market demand.
Combining Divergence and Convergence for High-Probability Setups
Using both concepts together provides an added layer of confirmation. For example:
- Regular deviation with convergence confirmation: If price forms higher highs but an indicator creates lower highs (bearish discrepancy), waiting for a breakdown in convergence can confirm the reversal.
- Hidden deviation with trend reinforcement: If price forms higher lows while an indicator forms lower lows (bullish hidden discrepancy), confirming convergence strengthens the likelihood of a trend continuation.
By analyzing both factors, traders can fine-tune entries, reducing the risk of acting on false signals.
How to Avoid False Patterns, Misleading Setups
Market fluctuations often create misleading setups that can trap inexperienced traders. Recognizing false patterns is essential to improving accuracy.
Common pitfalls, solutions:
- Price whipsaws without true momentum change: Occurs when an asset exhibits deviation but lacks volume confirmation. Waiting for a breakout or breakdown helps confirm the setup.
- Short-term discrepancy that corrects quickly: Sometimes, momentum indicators temporarily diverge before realigning with price. Using multiple timeframes helps identify stronger signals.
- Convergence without real market interest: Just because indicators confirm a trend doesn’t mean it will continue indefinitely. Checking for external factors such as economic events or institutional activity reduces unnecessary risk.
Knowing when to act on deviation as well as when to rely on convergence allows traders to navigate the markets with greater precision, increasing the probability of successful outcomes.
How to Trade Discrepancy Effectively
Momentum shifts in financial markets reveal key moments where trends weaken or prepare for continuation. Divergence in trading is a powerful tool, but identifying as well as acting on it requires precision. Knowing which indicators to use, which timeframes work best, how to confirm setups with additional technical factors can mean the difference between a successful trade and a false entry.

Step-by-Step Guide to Identifying Discrepancy
Selecting the right indicators
- MACD (Moving Average Convergence Divergence) – best for detecting shifts in momentum strength. When price moves in one direction but the MACD histogram or lines contradict, a shift may be near.
- RSI (Relative Strength Index) – excellent for identifying overbought along with oversold conditions. A mismatch between price and RSI levels suggests an impending trend change.
- Stochastic Oscillator – works well for short-term setups, confirming whether a market is losing steam or gaining strength.
Choosing the optimal iimeframe
- Short-term (5m-15m charts) – more noise but useful for scalpers. Requires stronger confirmation to avoid false setups.
- Medium-term (1h-4h charts) – ideal for day traders, swing traders, as it reduces random fluctuations while still capturing meaningful moves.
- Long-term (daily-weekly charts) – more reliable but takes longer to play out. Best for position traders who prefer fewer trades with high accuracy.
Confirming with support as well as resistance
- If price diverges from an indicator near a major resistance level, it strengthens the case for a reversal downward.
- If deviation forms near strong support, it increases the likelihood of an upward shift.
- Always check historical price reactions at key levels to validate the setup.
Using volume as a secondary confirmation
- Weakening momentum should align with decreasing volume for a potential reversal.
- If price moves against discrepancy but volume remains high, the trend may persist longer than expected.
Best Indicators for Recognizing Market Imbalances
Each momentum tool has its own strengths along with weaknesses. Knowing when to use each one improves accuracy.
1. MACD (Moving Average Convergence Divergence)
| Best for | Strengths | Weaknesses |
| capturing major momentum shifts in trending markets | smooths out noise | lags behind price |
| works well across different timeframes | can produce late signals |
2. RSI (Relative Strength Index)
| Best for | Strengths | Weaknesses |
| identifying overbought,oversold conditions | simple and effective for spotting weakening trends | can remain overbought/oversold for extended periods in strong trends |
3. Stochastic Oscillator
| Best for | Strengths | Weaknesses |
| detecting short-term momentum exhaustion | more responsive than RSI | more prone to false setups in volatile conditions |
| useful for timing entries |
Combining these tools with price action ensures better decision-making. Relying on a single indicator can lead to misinterpretations, especially during periods of high volatility.
Entry and Exit Techniques for Effective Trade Execution

Finding the right entry point
- Bullish setup: price makes a lower low while an indicator makes a higher low. Entry is confirmed when price breaks a minor resistance or a bullish candlestick pattern appears.
- Bearish setup: price forms a higher high while an oscillator shows a lower high. Enter when price rejects a resistance level or forms a bearish pattern.
Setting protective stop-loss levels
- Place stops below recent swing lows for long positions, above recent swing highs for short positions.
- Use ATR (Average True Range) to determine a reasonable stop distance based on market volatility along with divergence in trading.
Targeting profits with risk management
- First target: nearest support/resistance zone where price may react.
- Second target: measure the previous trend size, use that as a guide for potential price movement.
- Adjust stop-loss to breakeven once the trade moves in profit to protect capital.
Using additional confluences for higher accuracy
- Candlestick confirmation: reversal patterns like engulfing candles or pin bars improve the probability of success.
- Volume analysis: rising volume near the discrepancy setup increases reliability.
- Moving averages: if a trendline break aligns with the 50-period or 200-period moving average, it further strengthens the trade.
Mastering these techniques ensures better execution, reducing unnecessary risk while improving trade selection. Instead of chasing price movements blindly, combining deviation patterns with multiple confirmations creates a structured approach to capitalizing on market fluctuations.
Diver Trading: Common Mistakes, Best Practices
Momentum shifts can provide valuable insights, but misinterpreting them leads to costly errors. Many traders struggle with deviation due to misidentification, over-reliance on indicators, neglecting broader market conditions. Recognizing these pitfalls, applying best practices can significantly improve performance.

Common Mistakes in Deviation-Based Setups
1. Misreading Momentum Shifts
- One of the most frequent errors is spotting discrepancy where none exists. Price as well as indicators fluctuate constantly, minor inconsistencies do not always indicate a major shift.
- Strong trends often produce misleading setups. A stock in a powerful uptrend might show bearish deviation, but unless other confirmation factors exist, the trend could continue.
- Using multiple timeframes helps filter weak setups. A contradiction on the 5-minute chart might be irrelevant if the daily timeframe shows strong momentum.
2. Ignoring the Larger Market Structure
- Many traders focus only on indicators without considering overall market conditions. If a discrepancy pattern appears during a news event or earnings release, price action can easily override technical patterns.
- Strong support, resistance levels should always be considered. A setup occurring near a long-term resistance zone carries more weight than one in the middle of a price range.
- Trend strength must be factored in. When a market is in a clear bullish phase, betting against it based on one momentum shift often leads to unnecessary losses.
3. Over-Reliance on Indicators Without Price Action Confirmation
- Indicators like MACD, RSI, Stochastic are useful, but relying solely on them without checking candlestick patterns or market structure leads to poor decisions.
- False setups occur when traders enter too early, expecting an immediate reaction. A proper confirmation such as a trendline break, support bounce, or volume increase strengthens the validity of a setup.
- Higher probability trades come when multiple factors align—momentum imbalance, price action confirmation, key level interaction.
Best Practices for Consistently Identifying High-Quality Setups

1. Implementing Risk Control Measures
- Every position should have a predefined stop-loss as well as risk-to-reward ratio to prevent excessive drawdowns.
- The ATR (Average True Range) indicator can help determine logical stop placements based on volatility rather than arbitrary levels.
- Scaling out of trades allows for profit protection while keeping part of the position open for larger moves for those who know what is divergence in trading, how to use it.
2. Using Trendlines and Moving Averages for Confirmation
- A momentum shift aligned with a trendline break or moving average crossover increases accuracy.
- The 200-period moving average is one of the strongest filters for identifying whether a market is in a long-term uptrend or downtrend.
- If a bearish setup occurs above the 200-MA, it may not be reliable unless additional factors support the idea.
3. Practicing on Simulated Accounts Before Going Live
- Before committing real capital, testing setups in a demo environment helps refine execution skills without financial risk.
- Recording trades, reviewing results over time allows for adjustments as well as improvements.
- Developing patience is essential — forcing trades leads to unnecessary losses. The best setups do not appear every day, but waiting for ideal conditions ensures consistency.
Recognizing these best practices, avoiding common mistakes significantly enhances the ability to capitalize on momentum shifts with precision as well as confidence.
Advanced Deviation Trading Techniques
Momentum shifts in financial markets provide an edge when analyzed correctly. While basic applications focus on single timeframes, standard indicators, advanced techniques refine accuracy, reduce false setups, enhance decision-making. Integrating multi-timeframe analysis, automation, institutional-level techniques unlocks higher precision in discrepancy.

Multi-Timeframe Analysis for Stronger Trade Setups
Different timeframes reveal different perspectives. A setup forming on a 5-minute chart might be a minor pullback on the 4-hour timeframe, while a discrepancy pattern on the daily chart can indicate a major trend shift.
1. The Hierarchy of Timeframes
- Primary (higher timeframe): defines overall market direction (e.g., daily or weekly chart). If price is in an uptrend, bearish deviation on the 15-minute chart might be a short-lived correction rather than a full reversal.
- Secondary (intermediate timeframe): confirms setups by filtering out noise (e.g., 4-hour chart for swing traders).
- Execution (lower timeframe): provides refined entries with reduced risk (e.g., 15-minute or 1-hour chart).
2. How to Use Multi-Timeframe Analysis for Confirmation
- Identify deviation on the higher timeframe for trend context.
- Use the mid-range chart to look for validation (trendlines, moving averages, support/resistance).
- Enter positions on the execution timeframe once confirmation appears (price rejection, volume spike, momentum shift).
- Example:
- daily timeframe shows weakening bullish momentum;
- 4-hour chart confirms resistance holding, a MACD cross-down;
- 1-hour chart provides a lower high rejection, signaling an optimal entry.
Using multiple timeframes ensures setups align with broader trends, reducing false entries, improving trade precision.
Algorithmic and Automated Applications
Institutional traders as well as quantitative firms rely on automation to execute setups efficiently. Deviation is programmable, allowing algorithms to identify setups in real time.
1. Building Automated Discrepancy Models
- Data processing: algorithms scan multiple assets for momentum discrepancies.
- Indicator conditions: RSI, MACD, or custom oscillators detect deviation setups.
- Trend filtering: moving averages or volatility bands confirm trend direction before execution.
- Risk management: predefined stop-loss, take-profit rules protect capital.
2. Benefits of Algorithmic Integration
- Removes human bias, ensuring objective decision-making.
- Scans thousands of assets simultaneously, increasing trade opportunities.
- Executes trades instantly, preventing missed setups due to manual delays.
Some hedge funds integrate machine learning models to improve detection of divergence in trading. AI-driven systems analyze historical patterns, refining probabilities based on past success rates.
Institutional Approaches to Deviation-Based Setups
Professional market participants employ discrepancy analysis differently than retail traders. Instead of relying on a single timeframe or indicator, they combine multiple factors for confluence.
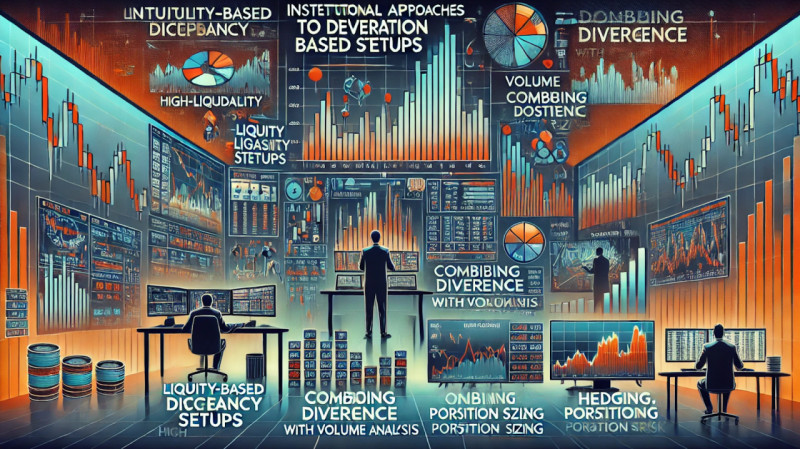
1. Liquidity-Based Discrepancy Setups
- Smart money watches order flow, liquidity zones instead of just indicators.
- If price shows deviation near high-volume zones, it strengthens the probability of reversal.
- Example: A stock forming bearish discrepancy at a major resistance zone with declining institutional buy orders confirms weakening strength.
2. Combining Divergence with Volume Analysis
- Volume deviation occurs when price makes higher highs, but volume declines, signaling reduced participation.
- If price forms lower lows, but volume rises, it suggests hidden accumulation.
- Institutions use this to anticipate reversals before the broader market reacts.
3. Hedging, Position Sizing
- Instead of outright reversals, professionals scale into positions based on divergence setups.
- Example: A trader identifies weakening bullish momentum but doesn’t short immediately — instead, they reduce long exposure, build short positions gradually.
- This approach allows professionals to stay aligned with the broader trend while preparing for shifts.
Applying Advanced Concepts for Higher Accuracy
- Multi-timeframe confirmation prevents premature entries.
- Automated systems reduce emotional bias, improve execution speed.
- Institutional techniques, such as liquidity-based setups along with volume discrepancy, add depth to decision-making.
Using these refinements increases the probability of successful trades while filtering out misleading patterns. Instead of reacting to every setup, incorporating advanced tools as well as professional methods creates a structured, high-precision approach to market movements.
Conclusion: Mastering Discrepancy
Momentum shifts expose market weaknesses before price action confirms them. The ability to recognize these moments, act accordingly is what separates skilled traders from those who rely on reactive decisions. Deviation is not a shortcut to success — it is a tool that requires skill, patience, discipline to use effectively. Mastering this concept involves more than just spotting irregularities between price and indicators. It requires a deep comprehension of trend strength, confirmation techniques, market psychology.
Key Takeaways for Consistently Identifying Market Shifts
Knowing the basics is not enough
- Recognizing regular, hidden, extended deviation is only the first step. Knowing when to act based on these patterns is what truly matters.
- Every market condition behaves differently. Some setups work better in strong trends, while others are more effective in range-bound environments.
Indicators alone are insufficient
- Momentum oscillators like MACD, RSI, Stochastic provide valuable insights, but relying solely on them leads to inaccurate setups.
- The strongest confirmations come when discrepancy aligns with support/resistance levels, price patterns, volume trends.
Higher timeframe confirmation increases reliability
- A momentum shift on a 5-minute chart can be misleading if the daily trend still points in the same direction.
- Looking at a broader picture prevents premature entries, reduces unnecessary risk.
Risk management is essential for long-term success
- Every setup should be accompanied by predefined stop-loss, take-profit levels to ensure capital protection.
- Proper position sizing ensures that no single trade can cause significant financial damage.
Market conditions determine effectiveness
- Certain setups of divergence in trading perform better in volatile conditions, while others work best in low-volume markets.
- Adjusting expectations based on broader trends improves accuracy, minimizes false entries.
How to Continuously Improve Execution and Precision
Analyze every setup — win or lose
- Keeping a detailed trading journal allows for pattern recognition, ongoing improvement.
- Reviewing past trades helps refine entries, risk management, overall execution.
Use a demo account before going live
- Testing discrepancy-based setups in a simulated environment eliminates emotional pressure.
- Practicing on multiple asset classes (stocks, forex, crypto) helps determine where these patterns are most effective.
Learn from market professionals
- Institutional traders use momentum shifts differently than retail traders. Comprehending order flow, liquidity zones, volume deviation adds depth to execution.
- Studying large market players improves the ability to differentiate between real reversals and temporary pullbacks.
Adapt to changing market conditions
- A setup that worked in a bull market may not be reliable during a bear phase.
- Flexibility along with the ability to adjust to new trends ensure long-term consistency.
Final Thoughts on Using Momentum Shifts as a Market Edge
Momentum-based setups are not just about identifying price exhaustion — they provide a structural advantage when applied correctly. Those who develop this skillset gain the ability to detect shifts before they happen, allowing them to make calculated, high-probability decisions. Deviation is not about following indicators blindly; it is about using them as tools for confirmation, filtering out weak setups, aligning with broader market trends.
Market success is not defined by how many trades are placed, but by the quality of each decision. Instead of chasing price action, mastering divergence in trading provides a structured approach to capturing profitable opportunities. The key lies in refinement, discipline, continuous learning — the foundation of long-term success in financial markets.


