

Financial markets are a dynamic battlefield where opportunities and risks coexist. Some see it as a game of speculation, while others treat it as a science driven by data, psychology, and strategic execution. Knowing what is trading along with the mechanics behind price movements, market participants, risk management is a foundation of turning volatility into profit.
From high-frequency decisions of professional firms to calculated moves of independent investors, every transaction contributes to the ebb and flow of the global financial ecosystem. Whether analyzing price charts, interpreting economic news, or automating strategies with algorithms, success in this environment depends on knowledge, discipline, adaptability.
This guide explores core principles, essential techniques, advanced strategies used in financial markets. Covering fundamental concepts, key trading patterns, risk management techniques, psychological factors, it provides a structured path for both beginners and experienced participants.
What is Trading in Simple Terms?
Comprehending the essence of bargaining begins with the simplest idea — buying something at one price and selling it at another, ideally for a profit. Whether it's physical goods, currencies, or digital assets, underlying the principle remains the same: capitalize on price movements. Unlike long-term investment strategies that focus on gradual wealth accumulation, short-term market activity aims to exploit volatility along with trends to generate returns more quickly.
The global financial ecosystem is vast, encompassing various marketplaces where individuals as well as institutions engage in asset transactions. Some focus on foreign currencies, others on commodities like gold and oil, while some specialize in company shares or complex financial derivatives. Each market has its own rules, rhythms, opportunities, but they all share one common trait — constant movement, driven by economic events, supply and demand, investor sentiment.

Buying and Selling: Core of Market Activity
The process of exchanging assets for potential gain revolves around price fluctuation. Every decision made by participants impacts the overall direction of an asset’s value. Some look for undervalued opportunities, purchasing at a low point and holding until the price rises, while others bet on declines, profiting from falling prices through short-selling techniques.
Market participants fall into different categories, each playing a unique role:
- Speculators operate with the goal of short-term profits, basing decisions on technical patterns and momentum.
- Institutional investors include hedge funds, banks, pension funds that engage in large-scale transactions, often influencing market trends.
- Market makers provide liquidity by continuously buying and selling, ensuring smooth transactions for others.
These groups interact in a highly dynamic environment, where strategies, experience, decision-making speed determine success.
Understanding the Landscape: Different Financial Markets
- Equities: buying company shares allows ownership in a business, with potential profit coming from price appreciation or dividends.
- Foreign exchange (Forex): global currency market operates 24/7, with participants exchanging national currencies based on economic factors, geopolitical developments.
- Commodities: precious metals, oil, agricultural products — physical goods traded based on global supply, demand, speculation.
- Derivatives: futures, options, contracts-for-difference (CFDs) let participants speculate on price movements without directly owning the underlying asset.
Each sector presents unique risks along with opportunities, catering to different risk appetites, strategic approaches.
Psychology Behind Market Participation
Success is not solely dependent on knowledge of market structures and what is trading. Emotional discipline plays an equally critical role. Fear of missing out (FOMO) can lead to impulsive decisions, while hesitation in volatile conditions may result in missed opportunities. The most effective market participants develop strategies based on logic, historical patterns rather than emotion-driven reactions.
Navigating the landscape requires continuous learning, adapting to evolving market conditions, refining techniques to manage risk as well as maximize gains. Whether stepping into this world for the first time or seeking to expand existing knowledge, a strong foundation is essential for long-term success.
What is the Essence of Trading?
At its core, the essence of bargaining is a constant battle between buyers and sellers, where supply and demand dictate every fluctuation. Those who can interpret these shifts, anticipate future trends gain the ability to capitalize on market movements, turning volatility into opportunity.
Financial markets operate as ecosystems where billions of dollars move every second. The force behind this movement? Human psychology, economic events, institutional activity. Every transaction — whether it's a small retail purchase or a massive institutional position — contributes to the supply-demand equation. When demand outpaces supply, prices rise. When the opposite happens, they fall. Knowing this fundamental principle is the first step in mastering any financial market.

Liquidity and Volatility: Lifeblood of the Market
A marketplace without activity is useless. Liquidity ensures that assets can be bought and sold quickly without significant price fluctuations. The more participants involved, the smoother transactions become. Markets with high liquidity, such as major currency pairs or blue-chip company shares, tend to have tighter bid-ask spreads, making it easier to enter and exit positions efficiently.
Then comes volatility — double-edged sword of financial markets. Sharp price swings create opportunities for quick profits but also introduce substantial risks. Some embrace rapid movement, thriving in highly volatile conditions, while others prefer stability, relying on slow, steady trends. Knowing how to manage exposure in different environments determines whether one remains in game long enough to see consistent results.
Psychology of Decision-Making: Greed and Fear
The financial world isn’t just a numbers game — it’s a psychological battlefield. Every participant, from institutional investors to independent retail speculators, experiences emotional swings of fear along with greed.
- Greed leads to overconfidence, pushing individuals to chase rising prices without considering risk. It fuels speculative bubbles, where prices detach from fundamental value.
- Fear does the opposite — causing hesitation, panic selling, missed opportunities. Sharp downturns often occur when participants collectively decide to exit positions, amplifying market crashes.
Knowing emotional triggers, developing discipline is crucial. Recognizing when a decision is being driven by impulse rather than logic separates those who thrive from those who struggle. The most successful market participants operate with a strategy, sticking to risk-management rules as well as executing decisions based on data rather than emotions.
Balancing Risk and Reward: Formula for Longevity
Every opportunity comes with a cost — risk. Exploring what is trading involves the ability to evaluate potential gain against possible loss that is the foundation of smart decision-making. Professionals don’t focus on winning every single time; they focus on making sure that their profits outweigh their losses in the long run.
- Position sizing: adjusting exposure based on market conditions.
- Stop-loss, take-profit strategies: limiting downside while locking in gains.
- Diversification: spreading capital across different assets to minimize risk concentration.
The key isn’t to win every time but to ensure that when gains happen, they exceed losses. Consistency, discipline, ability to adapt separate those who succeed from those who burn out.
Mastering Market Mechanics
Success comes from comprehending forces that drive price movement, managing emotions, maintaining discipline in the face of uncertainty. Those who can interpret liquidity, embrace volatility, control risk position themselves to capitalize on opportunities while avoiding unnecessary exposure.
Mastering mechanics behind supply and demand, emotional influence, strategic decision-making transforms market participation from speculation into a structured, repeatable process. Those who treat it as a skill — not a gamble — unlock potential to navigate financial markets with confidence as well as control.
What is Trading and Where to Start?
Opportunities exist wherever prices fluctuate. Whether it's foreign currencies, commodities, company shares, or derivatives, financial markets provide a way to capitalize on these movements. Those who know how to interpret trends, manage risk, execute well-timed decisions position themselves to benefit.

Choosing the Right Market
Different asset classes cater to different styles, risk appetites, strategies. Some are fast-moving as well as volatile, requiring quick reflexes, while others reward patience along with long-term planning.
- Forex (Foreign Exchange): most liquid financial market, open 24/5, where major currencies like USD, EUR, JPY are exchanged. Price movements are influenced by economic data, geopolitical events, central bank policies.
- Equities: buying and selling company shares offers exposure to global industries. Some focus on long-term investments, while others seek short-term gains from price swings.
- Commodities: precious metals, oil, agricultural goods are driven by supply, demand, macroeconomic factors. These tangible assets often serve as hedges against inflation.
- Derivatives (futures & options): complex financial instruments that allow speculation on price movements without directly owning the underlying asset. Requires a deep knowledge of contract structures along with risk management.
Each market has unique characteristics, selecting one depends on personal goals, available time, risk tolerance.
Finding a Reliable Platform
Market participation requires a gateway. Choosing the right service provider is essential for execution speed, cost efficiency, accessibility to market data.
- Fees, commissions: some platforms charge per transaction, while others operate commission-free but adjust bid-ask spreads. Comparing costs is crucial, especially for those executing frequent orders.
- Leverage, margin: some brokers offer capital amplification, allowing positions larger than account balances. While this increases potential returns, it also magnifies risk.
- Execution speed, slippage: fast-moving markets require platforms that process orders instantly. Delays or poor order fills can impact profitability.
- Regulation, security: established platforms operate under financial authority supervision, ensuring transparency as well as fund protection. Unregulated services carry higher risks of fraud or mismanagement.
Popular names in this space include MetaTrader, TradingView, ThinkorSwim, each offering different tools suited for technical analysis, automation, or fundamental research for those learning what is trading.
Practicing Before Committing Capital
Rushing into live-market participation without preparation leads to costly mistakes. Many platforms offer simulated environments where strategies can be tested risk-free.
- Demo accounts: simulated portfolios allow users to place hypothetical trades based on real-time market data. A valuable tool for testing different approaches.
- Backtesting strategies: historical price data helps evaluate past market behavior. Running a strategy against previous conditions reveals strengths along with weaknesses.
- Paper trading: manually recording hypothetical trades, their outcomes before executing them with real money builds confidence as well as discipline.
Developing consistency in a risk-free environment creates a smoother transition to live-market participation.
Mastering Market Analysis
Three primary approaches determine how price movements are evaluated:
| Technical analysis | Fundamental analysis | Sentiment analysis |
| Using historical price charts, indicators, patterns to predict future trends | Examining economic reports, company earnings, macroeconomic trends to determine asset valuation | Gauging overall market mood based on news, investor behavior, speculative positioning |
| Popular tools: moving averages, Fibonacci retracements, RSI, MACD | Key drivers include GDP growth, interest rates, employment data, corporate financial statements | Contrarian strategies often emerge when sentiment reaches extreme levels |
Blending these perspectives provides a well-rounded approach, reducing reliance on a single factor.
Stepping Into the Market with Confidence
The foundation of long-term success lies in preparation. Selecting the right market, choosing a reliable platform, practicing in a risk-free setting, mastering market analysis build a strong starting point. The first step starts with education, but the journey unfolds through experience.
What is the Salary of a Trader?
Success in financial markets is often measured by profitability, but income potential varies dramatically based on strategy, experience, capital, risk management. Some participants generate consistent profits, while others struggle to break even. The potential for earnings depends on multiple factors, including market conditions, skill level, whether one operates independently or within a proprietary firm.

Earnings in Different Market Environments
Income levels differ based on approach. Independent participants rely on personal capital, while institutions as well as proprietary firms provide access to significantly larger sums, offering a higher earning ceiling but also more stringent performance expectations.
- Independent retail participants: earnings fluctuate widely. Some make a few hundred dollars per month, while others generate six-figure annual profits. Success depends on initial capital, strategy consistency, ability to manage risk.
- Institutional market participants: employed by hedge funds, banks, or investment firms, these professionals receive fixed salaries with performance-based bonuses. Compensation can range from $50,000 to millions annually, depending on seniority as well as firm profitability.
- Proprietary firm professionals: those operating with a firm’s capital retain a portion of profits, usually 50-80%, without risking personal funds. Top performers earn substantial sums, but consistency is required to maintain funding.
Impact of Capital on Income Potential
Starting balance directly influences profit potential. A small account limits position sizes, while a well-funded portfolio allows for greater flexibility.
- Low capital ($1,000-$5,000): small accounts require strict risk management. Returns of 5-10% per month may seem impressive but result in modest dollar amounts.
- Mid-level capital ($10,000-$50,000): provides more flexibility along with ability to scale successful strategies. Monthly returns of 5-10% translate into meaningful income for those who master what is trading.
- High capital ($100,000+): enables access to multiple markets as well as larger positions. At this level, earnings become substantial, compounding profits accelerates growth.
Scaling an account responsibly is key. Overleveraging leads to rapid losses, while consistent gains allow for steady progression.
Proprietary vs. Independent Market Participation
Operating independently requires personal capital, discipline, and understanding of risk exposure. In contrast, proprietary firms provide funding in exchange for a share of profits.
| Independent pros | Independent cons |
| full control over decisions | personal capital at risk |
| no profit splits | high learning curve |
| ability to develop unique strategies | potential for long periods without income |
| Proprietary firm pros | Proprietary firm cons |
| access to significant capital | strict risk limits |
| reduced personal financial risk | profit-sharing agreements |
| structured learning environment | high-performance expectations |
Choosing between these paths depends on financial resources, risk tolerance, long-term goals.
Passive Income and Automated Strategies
Advancements in algorithmic execution allow market participants to generate income with minimal manual intervention.
- Automated strategies: bots execute predefined setups, reducing emotional decision-making.
- Copy trading: following experienced professionals allows beginners to earn while learning.
- Dividends, yield strategies: long-term portfolios generate passive income through dividends along with yield-based assets.
Diversifying income sources ensures financial stability, preventing reliance on a single approach.
Earnings Are a Reflection of Skill and Discipline
Understanding the bargaining process is only the first step — execution, consistency, capital management determine financial success. The potential for significant income exists, but results depend on education, discipline, adaptability. Some generate wealth, while others struggle due to poor risk management or emotional decision-making. Mastery takes time, but those who develop patience, a structured approach unlock long-term profitability.
Stock Exchange Spread is… Understanding Cost of Trading
Every financial transaction has a cost, even before considering profits or losses. The difference between buying and selling price of an asset plays a crucial role in determining efficiency of market participation. This price gap, known as bid-ask spread, is an invisible fee that every participant must account for. It is often overlooked by beginners but is one of the most critical elements influencing execution quality, profitability, overall market efficiency.

What Bid-Ask Spread Means, How It Affects Execution
When an order is placed, it must be matched with an opposite side — someone willing to sell when buying or vice versa. Bid price represents the highest amount buyers are currently willing to pay, while ask price is the lowest sellers are offering. The difference between these two values is the spread.
- Narrow spread: when the gap is small, transaction costs are minimal, allowing smoother order execution.
- Wide spread: larger gap increases costs, requiring a greater price movement before reaching profitability.
For those operating in fast-moving environments, even small changes in spreads can impact outcomes significantly. Highly liquid markets usually offer smaller spreads, while less active assets tend to have wider ones, making them more expensive to buy and sell.
How High Liquidity Leads to Tighter Spreads and Lower Costs
Mastering what is trading means knowing that liquidity is the volume of buy and sell orders available at any given time. When a financial instrument has a high number of participants actively placing orders, it creates a competitive environment where bid and ask prices stay close together.
- Popular currency pairs, major indices, blue-chip companies tend to have minimal spreads. These markets attract institutional firms, hedge funds, high-frequency execution, all contributing to tight pricing.
- Exotic currencies, lesser-known securities, illiquid assets often experience large bid-ask gaps. Fewer participants mean a wider difference between the best available buy and sell prices, increasing costs for those entering or exiting positions.
Efficient markets benefit participants by ensuring minimal friction between buying and selling, making tight spreads a desirable condition for anyone executing frequent transactions.
Impact of Volatility and News Events on Spread Size
While liquidity keeps spreads low under normal conditions, sudden changes in market sentiment can cause dramatic shifts.
- Economic releases: data such as employment reports, inflation figures, central bank decisions often trigger price surges, momentarily increasing spreads.
- Geopolitical events: wars, trade policies, unexpected political developments create uncertainty, leading to erratic pricing, wider bid-ask gaps.
- Market openings, closings: the first and last minutes of a session often see volatile movements, affecting execution costs.
Knowing when spreads tend to widen allows participants to adjust their approach, avoiding unnecessary costs.
Strategies for Reducing Cost of Spreads in Financial Markets
Those who actively manage execution costs gain a significant advantage over time.
- Trade during peak liquidity: sessions with the highest number of participants, such as overlap between London and New York hours in foreign exchange markets, tend to have the most favorable conditions.
- Avoid low-volume periods: spreads often widen during weekends, holidays, or after-hours sessions when institutional activity is minimal.
- Use limit orders instead of market orders: placing bids or offers at preferred prices allows better control over execution, avoiding unfavorable price slippage.
- Choose low-spread instruments: focusing on assets known for narrow bid-ask differences reduces transaction costs in the long run.
By optimizing order execution as well as knowing how spread dynamics change under different conditions, market participants improve efficiency, enhance their ability to navigate financial opportunities.
Understanding Spreads Improves Long-Term Performance
A deeper knowledge of the essence of bargaining includes recognizing hidden costs that impact results over time. Spreads are not just a technical detail — they define the cost structure of every position taken. Managing them effectively is the difference between long-term profitability and unnecessary losses. Those who account for these details gain a competitive edge, ensuring each transaction is executed with maximum efficiency.
Prop Trading: Trading with a Firm’s Capital
Access to significant capital is one of the biggest challenges in financial markets. Without sufficient funding, even the best strategies struggle to generate meaningful returns. This is where proprietary firms come into play, offering individuals the opportunity to operate with large capital pools without risking their own funds.

These firms provide capital to qualified participants, allowing them to engage in financial markets while following structured risk management rules. In return, profits are shared between participant and firm, creating a mutually beneficial model where performance determines financial rewards. Knowing what is trading within the framework of proprietary firms is crucial for those looking to leverage external funding to maximize potential returns.
How Proprietary Firms Operate
Unlike traditional asset management companies, proprietary firms do not manage external client funds. Instead, they deploy internal capital to exploit opportunities across various asset classes. The goal is to generate consistent profits while managing risk effectively. Most firms operate in one of two ways:
| In-house desks | Remote models |
| Participants work directly from the firm’s office, using cutting-edge technology, research tools, real-time market data | Some firms allow individuals to operate from anywhere in the world, providing access to capital through online platforms |
| Collaboration with analysts, senior professionals enhances decision-making | Remote models often involve a structured evaluation phase before full funding is provided |
| Direct access to institutional-grade liquidity, execution speeds | Proprietary algorithms, risk management tools ensure compliance with firm rules |
While different firms have varying structures, the core principle remains the same — capital is provided, risks are managed, and profits are split.
How Market Participants Get Funded Without Risking Personal Money
The path to securing funding varies depending on experience as well as firm requirements. Some firms recruit based on prior performance, while others conduct evaluation programs to identify skilled individuals.
- Profitability challenges: many firms require participants to demonstrate consistent performance over a test period before full funding is allocated.
- Risk limits: since firms are providing capital, strict rules govern position sizes, daily loss limits, maximum drawdowns.
- Performance-based scaling: those who prove their ability to generate returns often receive increased capital allocations over time.
Securing funding requires discipline, patience, adherence to the firm’s guidelines. Reckless behavior results in funding suspension, while consistent success leads to career growth within the firm.
Pros and Cons of Working with a Proprietary Firm
| Advantages | Challenges |
| No personal capital required – reduces financial risk while allowing access to larger positions | Profit splits – portion of earnings goes to the firm, unlike independent operators who retain full profits |
| Institutional-level resources – advanced research tools, technology, liquidity access | Strict risk management – tight rules on losses as well as position sizing can limit aggressive strategies |
| Structured growth path – performance-based scaling provides opportunities to manage larger amounts over time | High performance expectations – inconsistent results lead to capital reduction or funding termination |
| Focus on execution, not administration – no need to worry about client relations, fundraising, or regulatory compliance |
For those who can consistently deliver results, proprietary firms provide a unique opportunity to operate with substantial capital while minimizing personal financial exposure.
How Profit-Sharing and Risk Management Work in Proprietary Firms
Compensation structures vary across firms but typically involve a split of net gains. Standard profit-sharing models range from 50/50 to 80/20, with the individual keeping a larger share as performance improves.
Risk is tightly controlled to protect the firm’s capital. Strict guidelines ensure losses remain within acceptable limits, with predefined stop-out levels to prevent catastrophic drawdowns. Some firms impose maximum daily loss limits, while others employ trailing risk thresholds that adjust based on performance.
By combining structured risk management with scalable capital allocation, proprietary firms create an environment where skill, discipline, consistency determine financial rewards.
Unlocking Opportunities Without Personal Risk
For those who understand what is trading but lack sufficient capital to scale their strategies, proprietary firms offer a viable pathway to success. Access to institutional resources, structured risk controls, scalable funding make this model attractive to individuals seeking to maximize returns without risking personal funds.
While challenges exist, disciplined market participants who adhere to firm guidelines, maintain consistent results can build long-term careers within proprietary environments, benefiting from capital allocations far beyond what they could achieve independently.
Consolidation in Trading: Recognizing Market Indecision
Markets don’t always move in clear trends. There are times when price action slows down, volatility decreases, a financial instrument moves sideways instead of making decisive moves up or down. This phase of indecision, known as consolidation, is a crucial part of price behavior. It represents a temporary balance between buying and selling forces before a stronger move emerges. Knowing how to navigate these conditions is key to capitalizing on breakouts or profiting from short-term price oscillations.
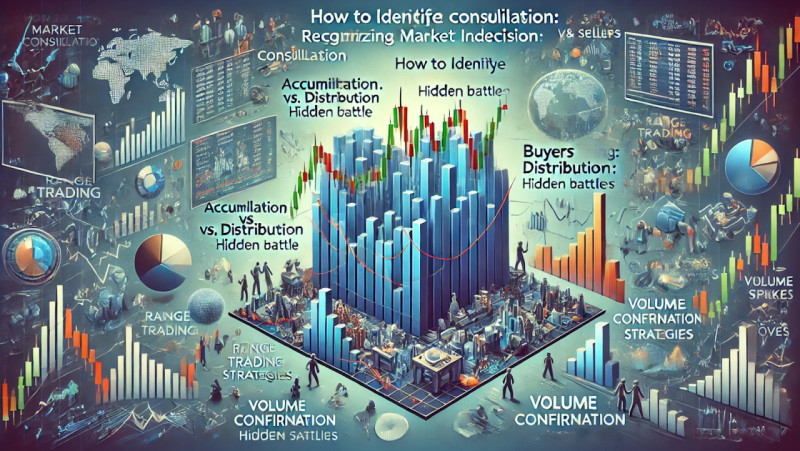
One of the most fundamental aspects of bargaining involves recognizing when a market is in accumulation, distribution, or trending mode. Identifying these phases early allows participants to prepare for the next significant move, whether it’s a continuation of prevailing trend or a complete reversal.
How to Identify Market Consolidation
Periods of reduced volatility often manifest in tight price ranges, where neither buyers nor sellers have full control. This occurs because large participants are accumulating or offloading positions in preparation for the next directional movement.
- Sideways price action: when price fluctuates within a narrow band without a clear trend, it signals a temporary standoff between demand and supply.
- Declining volatility: Bollinger Bands, Average True Range (ATR), other volatility indicators tighten during consolidation, showing reduced market activity.
- Support and resistance levels: prices often bounce between defined upper and lower boundaries, creating a predictable range.
A crucial distinction must be made between healthy consolidation, which results in breakouts, low-volume stagnation, which indicates a lack of participation rather than structured accumulation.
Accumulation vs. Distribution: Hidden Battle
Not all sideways movements have the same outcome. Some precede strong upward trends, while others mark the beginning of prolonged declines. Recognizing whether a market is in an accumulation or distribution phase can provide an edge.
- Accumulation phase: this occurs when institutions, long-term participants quietly build positions before a major upward movement. It’s often accompanied by higher volume on upward price moves, weaker volume on downward moves.
- Distribution phase: when large players unload positions without causing panic, prices appear stable, but smart money is exiting before a significant drop. This phase is characterized by frequent false breakouts, declining volume on rallies.
Observing volume behavior alongside price action is crucial to distinguish between these two phases.
Range Trading vs. Breakout Strategies
In the process of mastering what is trading when consolidation is identified, two primary approaches can be applied:
| Range-based approach | Breakout strategy |
| Buying near support and selling near resistance | Entering after price breaks out of the range with strong momentum |
| Using oscillators like RSI, Stochastic to confirm overbought or oversold conditions | Using volume confirmation to ensure the move is backed by institutional participation |
| Tight stop-loss placement below support or above resistance to limit risk | Setting stop-loss levels just outside the previous consolidation area to avoid false breakouts |
| Best suited for markets with stable conditions, clear price boundaries | Effective in markets with increasing volatility after prolonged sideways movement |
Each approach requires patience along with discipline, as false signals are common in consolidation zones.
Volume Confirmation: Key to Predicting Directional Moves
Volume is a powerful tool in knowing whether a breakout is real or if a market is simply faking direction.
- Breakouts on high volume: indicate strong conviction, higher probability of sustained movement.
- Breakouts on low volume: suggest a lack of interest, increased chances of reversal.
- Diverging volume trends: if price moves upward but volume declines, it may indicate weakening momentum.
By combining price structure with volume analysis, market participants can filter out weak signals, focus only on high-probability setups.
Mastering Market Indecision
Comprehending the bargaining process isn’t just about identifying trends — it’s also about knowing when the market is pausing, recalibrating, preparing for its next move. Consolidation phases provide valuable clues about future price direction, offering both range-bound opportunities and breakout setups for those who know how to interpret them correctly.
Mastering the ability to recognize market indecision, anticipate volume-based confirmations, apply the right strategy ensures that financial opportunities are captured with precision, rather than guessing when a breakout will occur.
Trailing Stop: Locking in Profits While Maximizing Gains
Protecting gains while allowing room for price movement is one of the biggest challenges in financial markets. Exit strategies determine whether a profitable position continues growing or reverses into a loss. A well-placed trailing stop solves this problem by dynamically adjusting exit point based on market conditions. Unlike a fixed stop-loss, which remains static, this method ensures that profits are secured while leaving space for further upward movement.
Identifying entry points is just the beginning, it’s also important to master the art of managing risk along with optimizing exits. Knowing when to cut losses is crucial, but knowing how to let winners run while locking in gains separates consistent success from short-lived victories.
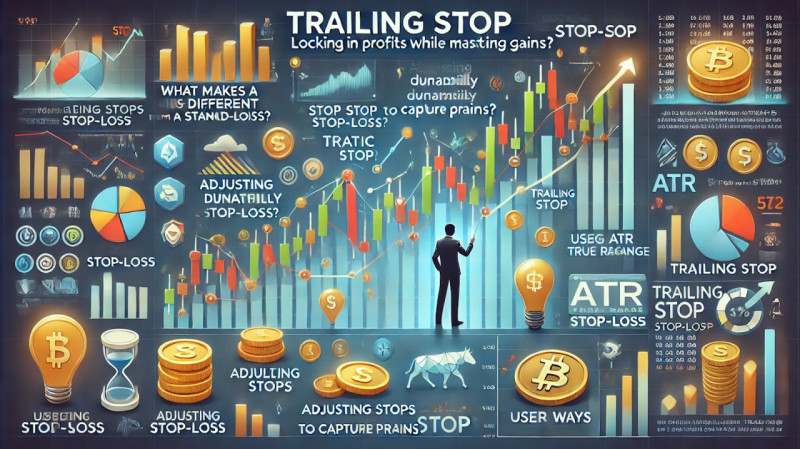
What Makes a Trailing Stop Different from a Standard Stop-Loss?
A traditional stop-loss is placed at a predetermined level, it remains unchanged until position is closed. While it effectively limits downside risk, it does not account for situations where price moves favorably. This is where a trailing stop provides a major advantage.
Instead of staying fixed, a trailing mechanism adjusts automatically as price moves in the desired direction. When an asset's value rises, the stop level moves up accordingly, securing additional gains. However, if price starts declining, the stop remains at its last adjusted position, ensuring that profits are preserved before a deeper reversal occurs in the process of exploring what is trading.
- Fixed stop-loss: remains in one place, only triggered if price drops to a specific level.
- Trailing stop: moves in the direction of profit, locking in gains while leaving room for continued growth.
This method is particularly useful for capturing extended trends while avoiding premature exits caused by short-term fluctuations.
Adjusting Stops Dynamically to Capture Profits
Markets do not move in a straight line. Price fluctuations occur due to natural volatility, liquidity changes, shifting investor sentiment. An effective trailing stop must be adaptive — too tight, position gets closed prematurely; too loose, profits are left unprotected.
Several approaches can be used to dynamically adjust trailing stops:
Percentage-based
- Stop follows price movement at a fixed percentage distance (e.g., 5% below the highest price).
- Ideal for volatile assets, where wide fluctuations are common.
Fixed point or pip-based
- A stop moves by a set number of points (e.g., 50 pips in currency markets or $5 in equities).
- Useful when following structured price patterns.
Moving average-based
- Follows a moving average line, ensuring position remains open as long as momentum continues.
- Effective in strong trends with limited pullbacks.
Volatility-based (ATR Method)
- Uses Average True Range (ATR) to set stop distances dynamically.
- Adjusts automatically based on current market conditions, preventing exits from minor fluctuations.
Best Ways to Set Trailing Stops for Different Asset Classes
Markets behave differently, requiring adjustments in stop placement.
- Equities, ETFs: percentage-based trailing stop (5-10%) works well due to steady price movement.
- Forex, commodities: ATR-based stops adjust for shifting volatility, preventing premature exits.
- Futures, derivatives: moving average trailing stops can be effective when tracking extended trends.
Experimenting with different methods helps refine a personal strategy that balances flexibility with risk protection.
Using ATR (Average True Range) for Effective Stop Placement
ATR measures market volatility, making it an excellent tool for setting stop distances. When an asset experiences high volatility, a wider stop is necessary to prevent premature exits. During calmer periods, a tighter stop ensures profits are not left unprotected.
- ATR-based calculation:
- Multiply ATR value by a factor (e.g., 2x ATR) to determine stop distance.
- Adjust based on market conditions — expanding in volatile periods, tightening when movements stabilize.
This method ensures that trailing stops adapt naturally to changing market behavior, increasing probability of capturing larger moves while avoiding unnecessary losses.
Maximizing Profits with Smart Exits
Exit strategies are equally important as finding entry points. A well-placed trailing stop secures profits while giving a position room to grow. Whether using percentage-based, volatility-adjusted, or moving average methods, adapting to market conditions ensures efficiency. Mastering this technique creates a structured approach to risk management, allowing gains to be maximized without constant manual adjustments.
Fractal Trading: Recognizing Repetitive Market Patterns
Markets may appear chaotic, but beneath the surface, price movements follow repetitive structures. These recurring formations — fractals — are found in nature, mathematics, financial markets alike. They serve as essential clues for identifying reversals, trend continuation points, optimal entry and exit opportunities. By analyzing these patterns, participants gain a deeper comprehension of what is trading beyond simple price action.

A fractal is a self-repeating pattern that appears across different timeframes. In financial markets, these formations act as a roadmap, highlighting key turning points where momentum shifts. Whether operating in short-term setups or long-term trends, recognizing these structures enhances decision-making, reduces uncertainty.
How Fractals Help Identify Reversals and Trends
At their core, fractals represent areas of temporary balance before the next significant price move. They appear as clusters of five or more candles, where a peak or trough forms in the middle, surrounded by smaller bars on each side.
- Bullish fractals: indicate potential trend reversals to the upside. Often formed when a central low is flanked by two higher lows on each side.
- Bearish fractals: signal possible downward shifts, with a central high surrounded by two lower highs on each side.
Fractals are particularly useful for identifying breakout zones, support and resistance levels, price exhaustion points. They work best when combined with volume analysis or additional technical indicators to confirm validity of signals.
Bill Williams' Fractal Indicator Explained
Bill Williams, a pioneer in market psychology, technical analysis, introduced the fractal indicator as part of his "Chaos Theory" approach. His methodology focuses on how markets evolve based on repeating patterns, underlying behavioral tendencies.
Indicator automatically marks fractals on a price chart, allowing for quick identification of key pivot points. While these formations alone do not dictate market direction, they provide valuable insight into trend continuation as well as reversal areas.
- Entry confirmation: bullish fractal above resistance suggests a potential breakout.
- Exit points: bearish fractal appearing after a strong rally may signal exhaustion.
- Stop-loss placement: positioning stops beyond fractal highs or lows helps reduce false exits.
Williams also emphasized using fractals alongside other tools, ensuring that signals are backed by multiple confirmations.
Combining Fractals with Fibonacci Retracements for Stronger Signals
Fractal patterns become even more powerful when used with Fibonacci retracement levels. Since both tools rely on natural repeating sequences, they reinforce each other in highlighting high-probability zones.
- Fractals forming near key Fibonacci levels (38.2%, 50%, 61.8%) strengthen reversal setups.
- When a fractal aligns with a Fibonacci extension level, it indicates a continuation pattern with an established target.
- Fractal clusters around a major retracement zone suggest strong support or resistance, preventing premature entries.
By combining these two methodologies, participants can refine their approach, ensuring that positions align with mathematically significant market levels.
Multi-Timeframe Fractal Analysis for Confirmation
A single fractal appearing on one timeframe may not provide enough confirmation, but analyzing multiple timeframes increases accuracy.
- Higher timeframes define the trend: if a bullish fractal forms on a weekly or daily chart, it carries more weight than one appearing on a 15-minute chart.
- Lower timeframes fine-tune entry points: short-term fractals help refine execution within larger trend structures.
- Alignment between timeframes strengthens signals: if a fractal reversal occurs across multiple timeframes, probability of success increases.
This approach ensures that entries align with broader market structure, reducing exposure to false breakouts, improving timing precision.
Mastering Market Structure Through Fractals
Mastering what is trading requires more than recognizing simple price movements. It involves identifying repetitive structures that reveal underlying psychology of market participants. Fractals provide a unique edge, allowing participants to spot emerging trends, confirm reversal points, optimize risk management strategies.
By integrating fractal analysis with Fibonacci retracements, multi-timeframe confirmations, volume dynamics, market participants gain a systematic, structured approach to navigating price action with greater confidence.
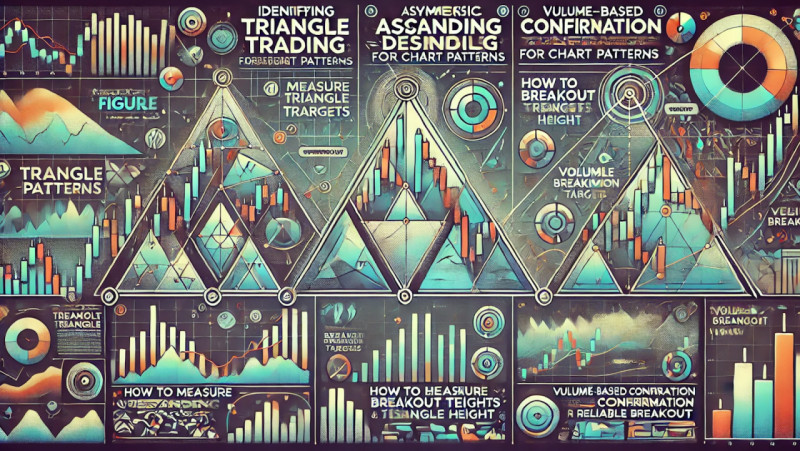
Triangle Figure Trading: Profiting from Chart Patterns
Markets are constantly shaping patterns that reveal the ongoing battle between buying and selling forces. Some of the most reliable formations signal a phase of consolidation before a strong breakout. Among these, triangle structure stands out as a powerful tool for identifying high-probability opportunities. Recognizing, interpreting these formations helps participants anticipate future price movements, enter positions with a well-defined strategy.
Comprehending the bargaining process involves more than just spotting trends — it requires ability to detect moments before explosive moves occur. Triangular formations provide this insight, offering a clear framework for setting precise entry and exit points.
Identifying Symmetrical, Ascending, Descending Triangles
Triangle formations appear when price movement contracts into a tighter range, forming a structure with converging trendlines. Key difference between these patterns lies in the slope, behavior of their boundaries.
| Symmetrical triangle | Ascending triangle | Descending triangle |
| Price forms lower highs and higher lows, creating a converging shape with no clear directional bias | A flat resistance level at the top, with rising lows forming a diagonal support line | A horizontal support level at the bottom, while lower highs form a downward-sloping resistance |
| Often seen as a continuation pattern, with a breakout typically favoring the prevailing trend | Indicates accumulation, where demand increases until it overcomes supply, leading to an upward breakout | Reflects a weakening market, as selling pressure dominates, buyers fail to push prices higher |
| Best confirmed with volume analysis, as lower participation during consolidation leads to explosive movement upon breakout | Frequently observed in bullish markets, suggesting buyers are gradually gaining control | Typically results in a bearish breakout, signaling continuation of a downtrend |
Correctly identifying these structures allows participants to prepare for the next move instead of reacting after it has already happened.
How to Measure Breakout Targets Based on Triangle Height
Projecting potential price movement is a key component of using these formations effectively. The standard method involves measuring the height of the triangle at its widest point and applying this distance to breakout level.
- Symmetrical triangles: target distance is measured from the widest part of the pattern, applied to the breakout point, either upward or downward.
- Ascending triangles: breakout target is set by adding the initial height of the formation to the resistance level.
- Descending triangles: projected move equals the vertical distance from the widest part, subtracted from the support level upon breakdown.
Applying these measurements ensures realistic expectations for price movement, helping manage risk while maximizing returns in the process of mastering what is trading.
Volume-Based Confirmation for Reliable Breakouts
Triangular formations alone do not guarantee a successful breakout. Volume plays a crucial role in determining whether a move is legitimate or a false signal.
- Declining volume during consolidation: indicates a buildup of energy, as fewer participants enter positions while waiting for confirmation.
- Surge in volume upon breakout: confirms commitment, as market participants react decisively to the breach of resistance or support.
- Low volume breakout warning: move without increased volume often results in a failed breakout, where price quickly reverses.
Combining volume analysis with pattern recognition improves accuracy, reduces likelihood of falling into market traps.
Examples of Successful Trades Using Triangle Formations
Historical price data shows numerous instances where triangular patterns have led to significant moves.
- Tech sector growth breakouts: companies in expansion phases often exhibit ascending triangles before major rallies, signaling institutional accumulation.
- Forex continuation trends: symmetrical triangles frequently appear in currency pairs during consolidation periods before resuming a dominant trend.
- Commodity market reversals: descending triangles have marked key breakdown points in precious metals, oil, signaling a shift in supply-demand dynamics.
Studying past examples helps refine pattern recognition skills, reinforces confidence in execution.
Capitalizing on Predictable Market Structures
Recognizing patterns within price movement provides a structured approach to decision-making. Triangle formations offer clear entry signals, breakout targets, risk management guidelines. Knowing how to identify consolidation zones can help prepare for the next directional move before it happens. Mastering these structures enables precise execution, improving probability of success in financial markets.
FOMO Trading: Emotional Trap That Ruins Accounts
Fear of missing out is one of the most dangerous psychological traps in financial markets. The urge to jump into a position simply because an asset is moving rapidly in one direction can lead to impulsive decisions, unnecessary risk, devastating losses. Those who fail to control this instinct often find themselves chasing price movements, entering positions too late, exiting at the worst possible time.

Without emotional discipline, even the best strategies fail. Ability to recognize as well as counteract impulsive behavior separates those who succeed from those who continuously give back their gains.
Why Fear of Missing Out Leads to Impulsive Decisions
Market participants are constantly exposed to situations where an asset surges in value within minutes. A news event, a sudden surge in buying volume, or a social media-fueled frenzy can create the illusion that if action isn’t taken immediately, opportunity will be gone forever. This triggers a powerful psychological reaction:
- Chasing late entries: buying after a strong move, only to watch the price reverse.
- Overleveraging: increasing position size out of desperation to catch a move.
- Ignoring risk management: entering without a clear stop-loss or plan.
- Emotional exit decisions: closing positions too soon due to anxiety or holding onto losses out of hope.
FOMO leads to irrational behavior, overriding logical analysis. Instead of waiting for confirmation or a structured setup, decisions are made in response to market movement, often resulting in poor outcomes .
Recognizing Market Conditions That Trigger Emotional Responses
Certain situations make emotional decision-making more likely. For those exploring what is trading to recognize these environments ahead of time reduces risk of impulsive action.
- Breakout markets: when prices are moving rapidly, temptation to jump in increases.
- News-driven events: economic data releases, corporate earnings reports, or major geopolitical events cause volatility that entices emotional participation.
- Social media, hype: trending discussions create urgency, making it feel like everyone is profiting while being left behind.
- Low liquidity periods: during times of low market participation, price swings can be exaggerated, making it seem like a massive move is happening when it’s just temporary.
Recognizing these conditions allows for strategic patience instead of emotional action.
Practical Ways to Build Discipline, Avoid Reckless Decisions
Developing emotional control requires structured steps to reduce impulsive actions:
- Set entry and exit rules: defining conditions before executing a position prevents reactionary decisions.
- Use limit orders: instead of chasing price, setting predefined levels ensures positions are taken only at optimal conditions.
- Reduce position size: if emotions are taking over, lowering exposure minimizes impact of impulsive decisions.
- Implement a cooldown period: stepping away from screen during volatile moments prevents emotional reactions.
The key is to remove a sense of urgency. The market will always present new opportunities, waiting for the right one is more valuable than rushing into an uncertain position.
Developing a Structured Plan to Stick to Your Strategy
A rules-based approach removes guesswork from decision-making. Instead of reacting to every move, a structured plan ensures that each decision aligns with a predefined strategy.
- Define risk per trade: establish a fixed percentage of capital to risk on each position.
- Use technical as well as fundamental confirmations: ensure multiple signals align before entering.
- Keep a trading journal: tracking past mistakes reinforces discipline, prevents repetition.
- Establish a routine: structured schedule reduces likelihood of overreacting to short-term movements.
By following a systematic plan, impulsive decisions are minimized, allowing for consistent execution based on logic rather than emotion.
Mastering Psychology for Long-Term Success
Emotional control is just as important as technical knowledge. FOMO destroys accounts by leading to irrational decisions, but with the right approach, it can be eliminated. Patience, discipline, a structured plan ensure that decisions are made based on strategy rather than impulse. Those who master emotional stability position themselves for long-term success while others continue to struggle with avoidable mistakes.
Death Cross Trading: Spotting Long-Term Bearish Trends
Markets don’t crash overnight. Large-scale declines often start with subtle warning signs that many overlook until it’s too late. One of the most well-known indicators of an extended downturn is Death Cross — a technical pattern that has historically preceded some of the worst financial collapses. Recognizing this signal early allows market participants to adjust their positions, hedge risks, or capitalize on falling prices through short-selling strategies.
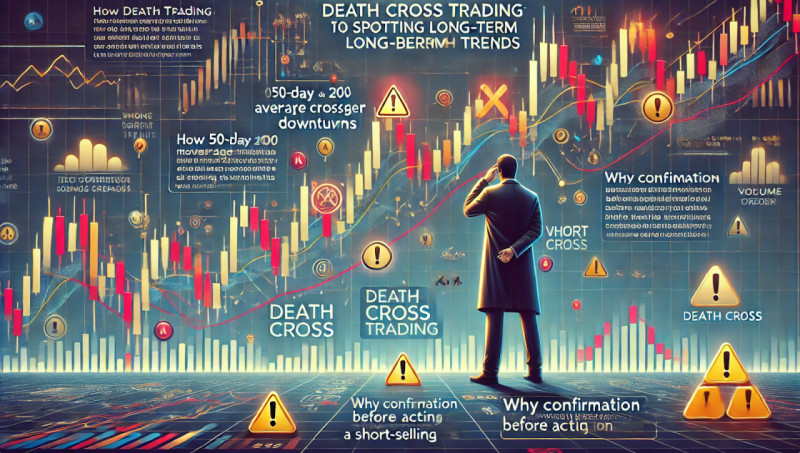
Mastering what is trading requires more than just knowing when to buy; knowing when to step aside — or even take advantage of downward momentum — is just as important. Death Cross provides a structured way to anticipate extended bearish conditions before they fully unfold.
How 50-Day and 200-Day Moving Average Crossover Signals Downturns
Death Cross occurs when the 50-day moving average crosses below 200-day moving average, signaling a shift in momentum from bullish to bearish. This crossover represents a fundamental change in market sentiment, as short-term weakness begins to overpower long-term stability.
- 50-day moving average: reflects recent price action, short-term market sentiment.
- 200-day moving average: represents broader trends, filtering out short-term fluctuations.
- Bearish crossover: when the shorter moving average drops below the longer one, it confirms growing downside pressure.
This signal doesn’t predict the exact moment of a crash but serves as a major red flag that further declines may be ahead. While not every Death Cross leads to a full-scale collapse, the pattern has reliably preceded some of the most devastating downturns in financial history.
Historical Examples of Major Market Declines Following a Death Cross
Death Cross has appeared before several market crashes, reinforcing its reputation as a warning sign.
- 2008 Financial Crisis: Death Cross appeared months before collapse of Lehman Brothers, marking transition into one of the worst economic downturns in modern history.
- 2000 Dot-Com Bubble: as overvalued tech companies began to collapse, crossover occurred, leading to years of declining prices.
- 2020 Pandemic Crash: although the market recovered quickly, Death Cross appeared before a sharp global sell-off.
While past performance doesn’t guarantee future outcomes, the pattern has a strong track record of appearing before extended bearish phases.
How Market Participants Use This Pattern for Short-Selling Opportunities
Instead of fearing a Death Cross, some view it as an opportunity. Downward momentum can be just as profitable as upward trends when approached with the right strategy.
- Short selling: borrowing assets to sell high and repurchase at lower prices.
- Put options: using derivatives to benefit from falling prices.
- Inverse ETFs: instruments designed to gain value as markets decline.
- Hedging portfolios: reducing exposure to riskier assets while increasing positions in defensive sectors.
Those who react early can benefit from downside trends instead of suffering through losses.
Why Confirmation is Necessary Before Acting on a Death Cross Signal
Despite its strong historical significance, blindly reacting to Death Cross without additional confirmation can lead to unnecessary losses. Some crossovers result in short-term dips before a recovery, making false signals a risk.
- Volume confirmation: Death Cross with increased selling volume is more reliable.
- Fundamental factors: economic data, earnings reports, macroeconomic trends should support the bearish case.
- Momentum indicators: tools like RSI, MACD, Bollinger Bands help gauge whether a move is gaining strength.
By combining technical analysis with broader market context, participants can improve accuracy as well as avoid misinterpreting temporary pullbacks as major downturns.
Mastering Market Cycles and Risk Management
Recognizing when market sentiment shifts is crucial for long-term success. Death Cross is a time-tested signal that warns of extended declines, providing a framework for adjusting strategies accordingly. Comprehending what is trading includes knowing when to pivot, hedge, or capitalize on downward trends. Those who master this concept position themselves to navigate volatility with confidence, turning market downturns into strategic opportunities.
Golden Cross Trading: Identifying Bullish Breakouts
Momentum shifts in financial markets do not happen randomly. They follow patterns, cycles, signals that reveal when an asset transitions from weakness to strength. One of the most recognized indicators of long-term upward momentum is Golden Cross — a technical pattern that has historically signaled the start of powerful bullish trends. This formation occurs when a short-term moving average crosses above a long-term moving average, confirming a shift in momentum that often leads to extended gains.

Mastering the process of bargaining requires identifying moments when market sentiment transitions from uncertainty to confidence. Golden Cross provides this insight, helping participants enter trends early as well as position themselves for maximum potential upside.
Significance of 50-Day Moving Average Crossing Above the 200-Day
Golden Cross is formed when the 50-day moving average surpasses the 200-day moving average, signaling that short-term momentum is accelerating faster than the longer-term trend.
- 50-day moving average: represents recent price action, reflecting short-term sentiment shifts.
- 200-day moving average: smooths out long-term trends, filtering out short-lived fluctuations.
- Bullish crossover: when the shorter average moves above the longer one, it confirms a transition from bearish to bullish conditions.
This crossover indicates that buyers are taking control, demand is increasing, the probability of sustained upward movement is higher. It doesn’t guarantee an immediate price surge, but historically, markets that experience this pattern tend to move higher over time.
Why Golden Cross is Considered a Strong Buy Signal
Unlike random price spikes, which can be fueled by speculation or short-term news, Golden Cross reflects a structural shift in demand.
- Institutional attention: large market participants, including hedge funds, investment firms, often use this signal as confirmation before increasing exposure.
- Psychological influence: since this pattern is widely recognized, it attracts buying interest from both professional and independent participants, reinforcing the uptrend.
- Long-term strength: historical data suggests that markets experiencing this pattern often sustain their uptrends for months or even years.
Not every Golden Cross leads to massive price appreciation, but it is widely regarded as one of the most reliable indicators of strong bullish sentiment.
How Market Participants Combine Golden Crosses with Momentum Indicators
Relying solely on a moving average crossover can lead to false signals, especially in choppy market conditions. To increase accuracy, professionals combine Golden Cross with additional confirmation tools:
- Relative Strength Index (RSI): reading above 50 suggests that momentum aligns with the crossover.
- MACD (Moving Average Convergence Divergence): positive MACD crossover strengthens validity of Golden Cross.
- Volume analysis: higher-than-average buying volume accompanying the crossover confirms strong market participation.
- Support, resistance levels: if the crossover happens near a major support level, it increases the likelihood of a successful breakout.
Integrating multiple indicators ensures that only high-probability setups are acted upon, reducing chances of reacting to misleading signals.
Backtesting Golden Cross Strategies for Improved Accuracy
Historical analysis helps determine whether Golden Cross works effectively across different market conditions in the process of mastering what is trading.
- Applying it to different assets: some financial instruments respond better to this signal than others; equities along with indices often perform well, while certain volatile assets may produce inconsistent results.
- Testing different timeframes: crossover on a daily chart carries more weight than one on a short-term timeframe.
- Filtering out false positives: identifying instances where the crossover failed helps refine risk management strategies.
Backtesting past occurrences allows for better understanding of when Golden Cross is most effective, ensuring that future decisions are based on statistical evidence rather than speculation.
Mastering Trend Identification for Long-Term Growth
Recognizing momentum shifts is an essential skill in financial markets. Golden Cross provides a structured approach to identifying transition from weak price action to sustained bullish trends. Comprehending the bargaining process includes knowing how to align with major market movements rather than reacting to short-term noise. Those who combine Golden Cross with strong confirmation signals position themselves for long-term success, increasing probability of catching extended uptrends before they fully develop.
Bear Trap Trading: Avoiding False Sell Signals
Market movement is rarely as straightforward as it appears. Sharp declines can create the illusion that an asset is heading into a prolonged downtrend, only for prices to reverse sharply, leave those who sold at the bottom scrambling to recover. This deceptive pattern — known as a bear trap — is a carefully engineered market event that tricks participants into taking positions based on false signals. Recognizing these setups early can prevent unnecessary losses, even create opportunities for profitable entries before a rapid recovery.
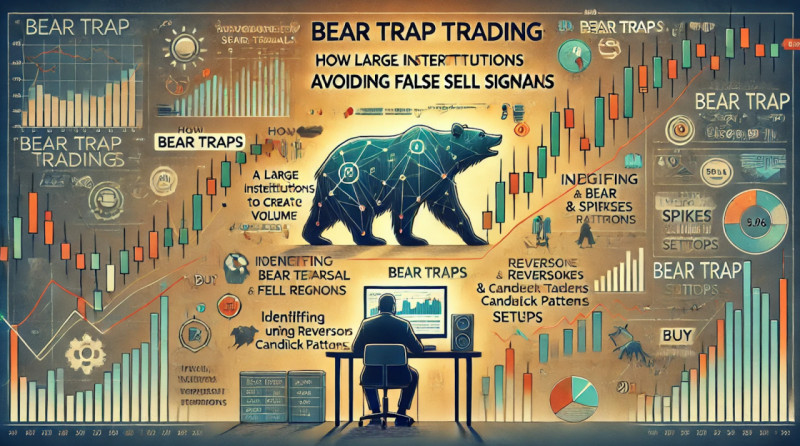
The bargaining process involves detecting market manipulation, false breakouts, psychological traps set by larger participants.
How Large Institutions Manipulate Markets to Create Bear Traps
Deep-pocketed market participants have the ability to influence price movement in ways that retail investors cannot. By strategically placing large sell orders, creating artificial downward pressure, institutions can induce panic among smaller players, triggering stop-losses along with forced liquidations. Once enough selling momentum builds up, they step in, absorb these positions at discounted prices before pushing the market higher.
Common tactics include:
- Triggering stop-losses: sudden dip below a key support level forces automatic exits from those using tight risk management.
- False breakdown confirmation: institutions create the illusion of a genuine downtrend, only to reverse price aggressively.
- Using news events: negative headlines can be used as justification for a sell-off, even if the fundamentals don’t support long-term declines.
This manipulation is a game of patience, those who recognize it avoid falling into the trap while positioning themselves for the next upward move.
Identifying Bear Traps Using Volume and Candlestick Patterns
Not every drop in price is a trap, so distinguishing between genuine breakdowns, manipulated moves is critical for mastering what is trading. Several clues help determine whether downward momentum is sustainable or merely an engineered setup.
- Volume discrepancy: if a breakdown happens on low volume, it signals weak conviction, making a reversal more likely.
- Sharp reversals: sudden bounce after a breakdown indicates that sell orders were absorbed by larger participants.
- Fake candlestick patterns: long wick beneath support followed by a strong close above it is a clear sign of a bear trap.
- Divergence in indicators: if momentum oscillators (like RSI or MACD) show bullish divergence while price is falling, it suggests manipulation rather than genuine selling pressure.
Identifying these signals prevents emotional decision-making, allowing for better positioning before the market turns against those caught in trap.
How Market Participants Profit from Bear Trap Setups
Once a bear trap is identified, there are several ways to capitalize on the upcoming reversal:
- Entering at support reclaims: if price falls below a key level but quickly reclaims it, this confirms the trap, provides a strong entry point.
- Using stop hunts to advantage: waiting for liquidity sweeps before entering ensures positions are aligned with the larger market players.
- Leveraging short covering rallies: as trapped sellers rush to cover losses, prices often surge, creating a rapid upside move.
- Pairing with volume spikes: when a bounce occurs with a sudden increase in volume, it strengthens the likelihood of continued recovery.
Those who recognize mechanics of bear traps turn market deception into an opportunity rather than a setback.
Examples of Famous Bear Traps in Market History
Several historical cases showcase how bear traps have misled participants before major reversals:
- 2009 financial crisis bottom: markets appeared to be in free fall, trapping short sellers before a massive decade-long bull run began.
- March 2020 market crash: after an extreme sell-off, many assumed further declines were inevitable, only for a sharp reversal to erase losses within months.
- Tech stock sell-offs: many high-growth companies experienced fake breakdowns before rallying to new all-time highs.
Studying these examples reinforces the importance of avoiding emotional reactions to sharp declines, instead looking for confirmation before acting on sell signals.
Turning Deception into Opportunity
Financial markets are designed to punish emotional decision-making. It’s necessary to recognize that not every price drop is a signal to sell. Large institutions create bear traps to accumulate positions at lower prices, shaking out those who react without confirmation. By learning to identify these setups, participants not only avoid unnecessary losses but also capitalize on sharp reversals, turning manipulation into an advantage.
Divergence in Trading: A Powerful Indicator of Market Reversals
Markets rarely move in a straight line. Price action is a constant push and pull between buyers and sellers, creating trends that either continue or reverse. While many look at price alone to determine momentum, a deeper layer of analysis reveals a hidden edge — divergence. This phenomenon occurs when an asset's movement contradicts key momentum indicators, signaling that an existing trend may be losing strength before a major reversal takes place.
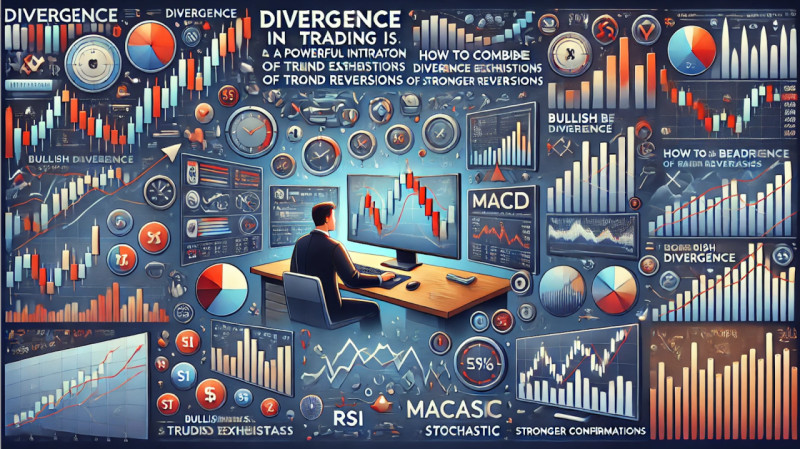
Exploring what is trading requires the ability to anticipate shifts in sentiment before they fully develop. Divergence is one of the most reliable tools for spotting these shifts early, providing an opportunity to exit weakening trends or enter positions before the next major move begins.
What Divergence Is and Why It Signals Trend Exhaustion
Divergence appears when price action, technical indicators move in opposite directions. While an asset may be reaching new highs or lows, momentum indicators such as the Relative Strength Index (RSI), Moving Average Convergence Divergence (MACD), Stochastic Oscillator may suggest a loss of strength. This conflict indicates that the current trend is running out of fuel, increasing the likelihood of a reversal.
- Regular divergence: sign that momentum is weakening, even though price continues in the same direction. Often an early warning of an upcoming reversal.
- Hidden divergence: suggests that a trend is regaining strength after a correction, signaling a continuation rather than a reversal.
Recognizing these patterns allows for strategic entries, exits, preventing unnecessary risk while positioning for high-probability moves.
Bullish vs. Bearish Divergence Explained with RSI, MACD, Stochastic
Different indicators provide unique ways to detect divergence, each offering valuable confirmation when used correctly.
Bullish Divergence (Reversal to the Upside)
Occurs when an asset forms lower lows, but indicators show higher lows — suggesting that downward momentum is weakening, a potential recovery is near.
- RSI divergence: if the Relative Strength Index forms higher lows while price is making lower lows, buying pressure may be increasing.
- MACD divergence: rising MACD histogram while price declines indicates that momentum is shifting.
- Stochastic oscillator: higher low in the stochastic reading while price falls signals that selling pressure is fading.
Bearish Divergence (Reversal to the Downside)
Happens when an asset reaches higher highs, but indicators print lower highs, hinting that upward momentum is losing steam.
- RSI failing to confirm new highs: classic warning sign that price action is outpacing actual demand.
- MACD histogram shrinking: even as price climbs, a weakening MACD indicates that bullish strength is declining.
- Stochastic overbought signals: decreasing stochastic value while price makes new highs suggests a lack of buying enthusiasm.
Using these signals in combination with other technical tools increases the accuracy of market timing.
How to Combine Divergence with Price Action for Stronger Confirmations
Divergence is a powerful clue, but relying on it alone can lead to false signals. Strengthening its reliability involves pairing it with other techniques:
- Support, resistance zones: if divergence appears near a historical price level, chances of a reversal are higher.
- Candlestick patterns: reversal formations like engulfing candles or pin bars confirm weakening momentum.
- Volume confirmation: divergence signal with a sudden volume spike strengthens probability of a valid shift in trend.
Blending these elements provides a multi-layered approach, improving decision-making as well as minimizing unnecessary risk.
Real-World Examples of Divergence Predicting Market Reversals
History has shown that divergence precedes major turning points across various asset classes.
- 2018 market selloff: clear bearish divergence on RSI appeared before a multi-month downturn, allowing those who mastered what is trading to spot it, exit early.
- Gold’s recovery in 2020: bullish divergence in MACD hinted at a major uptrend before prices surged to all-time highs.
- Tech sector boom and corrections: bearish divergence repeatedly signaled temporary tops in high-growth assets before sharp pullbacks.
Learning from these examples reinforces the importance of spotting divergence early, acting with confidence.
Mastering Market Timing with Divergence
Recognizing shifts in momentum before they fully develop is a critical skill. Divergence offers a clear, data-driven way to identify when a trend is weakening, allowing for better entries, exits, overall risk management. Comprehending the bargaining process means looking beyond surface-level price action, into hidden signals that drive major movements. Those who integrate divergence into their strategy gain the ability to anticipate changes before the broader market reacts — turning uncertainty into opportunity.
Cluster Analysis Trading: Understanding Market Liquidity
Every financial market operates as a dynamic battlefield where buyers and sellers engage in a constant struggle for dominance. Price movements are not random; they reflect collective behavior of participants, ranging from retail investors to institutional giants. Key to deciphering this behavior lies in understanding liquidity — how orders are placed, executed, absorbed at different price levels. Cluster analysis provides an advanced method to uncover hidden market dynamics, exposing areas where major participants are accumulating or distributing assets.

While price action shows the outcome of supply and demand, volume clusters reveal the underlying intent of those driving market direction. By analyzing order flow, liquidity distribution, participants gain an edge, allowing them to anticipate significant moves before they fully develop.
How Volume Clusters Reveal Institutional Buying and Selling Zones
Market-moving players do not execute orders like smaller participants. Large institutions — hedge funds, banks, proprietary firms — spread their orders across multiple price levels to avoid drawing unnecessary attention. These positions create volume clusters, areas where a high concentration of transactions occurs, often marking significant turning points.
- High-volume nodes: these zones indicate strong accumulation or distribution areas, acting as major support or resistance.
- Low-volume nodes: represent areas where interest is weak, often leading to rapid price movement due to lack of liquidity.
- Volume spikes on breakouts: surge in executed orders confirms that institutional players are backing a move, increasing probability of follow-through.
Recognizing these clusters helps filter out noise, focus on price levels where high-value transactions are taking place.
Using Footprint Charts to Track Order Flow
Traditional price charts display historical movement, but they lack visibility into how buying and selling pressure is distributed in real-time. Footprint charts solve this problem by displaying detailed information about executed orders at each price level.
- Bid vs. ask imbalance: shows whether aggressive buyers or sellers are dominating at a given price.
- Delta analysis: measures the difference between buy and sell market orders, highlighting shifts in momentum.
- Absorption zones: areas where large limit orders absorb market orders, indicating potential reversals.
Footprint analysis provides a real-time look into market liquidity, allowing for precision in identifying optimal entry as well as exit points for those exploring what is trading.
How Cluster Analysis Helps Identify Support and Resistance
Instead of relying solely on historical price action to determine key levels, cluster analysis provides a data-driven approach to defining where buying along with selling pressure is concentrated.
- Confirmed support levels: when volume clusters align with historical lows, they reinforce a strong demand zone.
- Validated resistance zones: high-activity price areas where sellers repeatedly overpower buyers signal strong resistance.
- Breakout validation: price level with significant volume absorption is more likely to hold, while weak liquidity zones often result in false breakouts.
Unlike static support and resistance drawn based on past price swings, cluster-based levels dynamically adjust with market conditions, providing a more adaptive framework for decision-making.
Best Tools, Platforms for Cluster-Based Analysis
Analyzing volume distribution requires specialized software capable of processing large amounts of market data in real-time.
- Sierra Chart: advanced order flow analytics, including footprint charts, volume profiles.
- Bookmap: highly visual platform that displays real-time liquidity, order book activity.
- NinjaTrader: features comprehensive volume-based tools for market depth analysis.
- Quantower: Offers a wide range of execution, liquidity-tracking tools for professional use.
Choosing the right platform depends on market preference, execution style, the depth of analysis required.
Unlocking Market Intent with Volume-Based Insights
Mastering liquidity analysis separates short-term speculation from strategic decision-making. Instead of reacting to price alone, it’s important to recognize where significant interest is concentrated, who is participating at key levels, how market structures form over time. Those who integrate cluster analysis into their approach gain a clearer, more predictive view of price movement, allowing for smarter execution as well as better risk management.
Pair Trading: Market-Neutral Strategy for Risk Reduction
Financial markets are unpredictable, influenced by economic events, investor sentiment, institutional flows. While many approaches rely on forecasting price direction, there’s an alternative that removes the need to predict outright movement — pair trading. This strategy focuses on the relationship between two correlated assets, allowing participants to profit from their relative performance rather than guessing market trends.

Market-neutral approaches like pair trading reduce exposure to broad market swings, focusing instead on the strength or weakness of one asset relative to another. This creates opportunities in both rising and falling conditions, making it an ideal strategy for volatile environments.
What Pair Trading Is and How It Works
At its core, pair trading involves opening two positions simultaneously:
- Going long on an asset expected to outperform.
- Going short on a correlated asset expected to underperform.
The goal is to profit from relative price movement between two instruments, rather than their absolute direction. If an asset bought gains more (or loses less) than the asset sold, the position is profitable.
This strategy works best when both assets have a strong historical correlation — meaning their prices tend to move in the same direction. When an imbalance occurs, pair trading allows participants to capitalize on expected reversion to the mean.
Examples of Pair Trading in Action
This strategy applies across different asset classes, from equities to commodities and currencies. Some of the most well-known pair trading setups for those who learn what is trading include:
- Tech rivals: Apple vs. Microsoft
- If Apple is significantly outperforming Microsoft beyond normal correlation, selling Apple while buying Microsoft could profit from a rebalancing.
- Precious metals: gold vs. silver
- When gold rallies while silver lags, going long silver and short gold can capture the price convergence.
- Energy sector: Brent Crude vs. WTI Crude
- Differences in global oil pricing create periodic imbalances, allowing for pair-based opportunities.
These relationships fluctuate based on market conditions, identifying the right pairs requires statistical analysis.
Using Correlation and Beta Values to Identify Pairs
Finding effective pairs involves more than guessing relationships — it requires data-driven insights.
- Correlation coefficient: measures strength of a relationship between two assets on a scale of -1 to 1.
- +1: Prices move together almost perfectly.
- 0: No relationship.
- -1: Prices move in opposite directions.
- Beta value: measures an asset’s volatility relative to the broader market.
- High-beta stocks move aggressively, while low-beta assets are more stable.
- Pairing assets with similar beta values ensures balanced risk exposure.
A well-structured pair trading strategy relies on statistical relationships rather than speculation, increasing probability of success.
Risk Management in Pair Trading Strategies
Even market-neutral approaches require strong risk controls.
- Position sizing: allocating capital proportionally to maintain a neutral portfolio.
- Stop-loss levels: setting exit points in case correlations break down unexpectedly.
- Divergence thresholds: determining how far an asset must deviate before entering a position.
- Mean reversion timing: not all pairs revert quickly — ensuring enough capital to withstand short-term fluctuations is essential.
Executing without risk management can lead to unexpected losses, especially if one asset decouples from the relationship.
Mastering Market-Neutral Strategies
Profiting from relative price movement eliminates the need to predict market direction, making pair trading one of the most resilient approaches in uncertain environments. Those who integrate statistical analysis with disciplined risk management gain an edge, capitalizing on inefficiencies that many overlook.
Deviation Trading: Using Standard Deviations to Find Opportunities
Price movement is rarely random. Every shift in value follows patterns influenced by market participants, economic events, liquidity conditions. However, intensity along with speed of these movements vary. Some periods experience minimal fluctuations, while others witness extreme volatility. Knowing these deviations from norm is essential for identifying high-probability setups, timing entries with precision.

Standard deviation is one of the most effective tools for measuring volatility. It reveals how far an asset's price has strayed from its average, providing insight into whether a move is sustainable or likely to reverse. Recognizing deviations from historical price behavior allows participants to develop structured strategies that capitalize on overbought and oversold conditions, mean reversion setups, trend breakouts.
Understanding the bargaining process means learning to interpret volatility rather than reacting emotionally to rapid price swings. Deviation-based strategies turn uncertainty into opportunity by focusing on probability rather than speculation.
How Standard Deviation Measures Market Volatility
Price movements tend to oscillate around an average over time, but deviations from this mean indicate potential trade opportunities. Standard deviation is necessary for those who want to know what is trading because it quantifies these fluctuations, measuring how far current prices have diverged from their historical norms.
- Low standard deviation: suggests a period of stability, often preceding a breakout.
- High standard deviation: indicates increased volatility, signaling potential trend exhaustion or continuation.
This statistical tool is the foundation for numerous volatility-based indicators, helping participants determine whether an asset is overextended or consolidating before its next major move.
Bollinger Bands and Keltner Channels in Deviation Trading
Two of the most popular volatility-based indicators, Bollinger Bands and Keltner Channels, use deviation to define price extremes.
| Bollinger Bands | Keltner Channels |
| Consist of a middle moving average, two outer bands representing standard deviation levels | Based on Average True Range (ATR) rather than standard deviation |
| Price touching or breaching the upper band suggests overbought conditions | Narrowing channels indicate low volatility, setting the stage for a breakout |
| Price reaching the lower band signals a potential oversold state | Expanding channels confirm increasing volatility, guiding momentum-based strategies |
Both indicators help determine whether current price action is statistically justified or deviating beyond normal expectations, creating opportunities for reversal or breakout trades.
Mean Reversion Strategies Based on Price Deviations
Assets tend to return to their historical average after excessive deviations. This phenomenon, known as mean reversion, forms the basis for numerous strategies.
- Overbought, oversold conditions
- When price deviates significantly from the mean, it often retraces back to equilibrium.
- Combining standard deviation with oscillators like RSI improves accuracy.
- Reversion to moving averages
- Assets that stray too far from their moving average often revert, making moving averages strong dynamic support or resistance levels.
- Volatility-based position sizing
- Higher deviation environments require adjusting risk parameters to avoid excessive exposure.
Executing mean reversion strategies effectively requires patience along with confirmation, as assets can remain overbought or oversold longer than expected.
How Traders Use Deviation to Find High-Probability Setups
Deviation trading is not about reacting to every price spike — it’s about identifying moments when price movement statistically exceeds normal behavior.
- Trend continuation signals: if price breaks through a deviation threshold with increasing volume, it often confirms a strong move.
- Reversal patterns: extreme deviations combined with divergences in momentum indicators strengthen reversal setups.
- Adaptive risk management: adjusting stop-loss placement based on deviation ensures positions are not prematurely closed due to normal fluctuations.
Comprehending the bargaining process means recognizing that markets fluctuate within measurable boundaries. By mastering deviation-based strategies, participants gain an objective way to filter noise, confirm entries, manage risk effectively, transforming volatility into a structured advantage.
Martingale Trading: A Risky Money Management Strategy
Success in financial markets is often linked to strategy, discipline, risk control. Some approaches rely on technical analysis, others on fundamental research, but all require proper capital management to survive long-term volatility. Among the most debated money management techniques is the Martingale system, a strategy that involves doubling the position size after every loss, under the assumption that a single win will recover all previous losses as well as secure a profit.
While this approach may sound mathematically foolproof, real-world market conditions introduce significant risks. Comprehending what is trading means knowing that no strategy guarantees profits indefinitely. Market trends can persist longer than expected, liquidity may dry up, leverage can amplify losses beyond control. Without strict limitations, the Martingale method can wipe out an entire account in a matter of minutes.
The Martingale System Explained: Doubling Position Size After Losses
The logic behind Martingale is simple: every time a position results in a loss, the next trade size is doubled. When a winning trade eventually occurs, it recovers all prior losses, providing a small net profit.
Example of a Martingale sequence with a base position of $10:
- Trade 1: Loss (-$10) → Next bet: $20
- Trade 2: Loss (-$20) → Next bet: $40
- Trade 3: Loss (-$40) → Next bet: $80
- Trade 4: Win (+$80) → Total profit: $10
Theoretically, as long as capital is unlimited and a win eventually occurs, losses are always recovered. However, real markets don’t function in a vacuum — long losing streaks can lead to exponential risk exposure.
Why Martingale is Dangerous in Highly Leveraged Markets
Markets are unpredictable, trends can extend far beyond expectations. Risk of doubling position sizes increases exponentially when using leverage, as both margin requirements along with potential losses grow out of proportion.
- Exponential drawdowns: losing streak of just five consecutive trades requires 32 times the original position size. A 10-trade losing streak could bankrupt an account.
- Margin calls: brokers enforce liquidation rules when losses exceed available margin, forcing positions to close automatically at a loss.
- Emotional impact: psychological stress of ever-increasing risk leads to panic-driven decisions, often worsening the situation.
Applying Martingale in leveraged environments often results in catastrophic losses rather than consistent recovery.
Safer Alternatives: Anti-Martingale and Position Sizing Strategies
Instead of increasing position size after a loss, risk management should focus on adjusting exposure based on market conditions, account stability.
- Anti-martingale strategy: instead of doubling down after losses, this approach increases position size after a win, allowing profits to grow while controlling downside risk.
- Fixed percentage risk model: allocating a set percentage (e.g., 1-2%) of capital per trade prevents excessive exposure.
- Kelly criterion: mathematical formula used to determine optimal bet sizing based on probability as well as edge, reducing unnecessary risk.
These approaches prioritize survivability over aggressive recovery, ensuring that one losing streak does not erase an entire account.
Examples of Market Participants Who Successfully Used Martingale with Risk Controls
Despite its inherent risks, some professionals have modified Martingale principles by introducing safeguards:
- Hedge funds with deep liquidity: some institutional firms use controlled Martingale methods with hedged positions, ensuring that losses remain within predefined limits.
- Options traders with limited risk: strategies involving credit spreads or hedged positions allow for Martingale-style adjustments without unlimited downside.
- Automated systems with stop-loss mechanisms: algorithmic strategies that incorporate dynamic risk controls can mitigate dangers of uncontrolled doubling.
While these adaptations reduce dangers of Martingale, they never remove risk entirely. Even with modifications, exponential exposure remains a significant challenge.
Mastering Risk Instead of Chasing Losses
Financial markets reward risk control, patience, adaptability. Martingale approach, while mathematically intriguing, ignores real-world constraints like leverage, liquidity, psychological stress. Understanding what is trading requires accepting that losses are part of the process. Instead of chasing losses with unlimited exposure, structured risk management along with capital preservation lead to long-term sustainability as well as success.
VSA Analysis: How Volume Reveals Smart Money Moves
Markets are often described as chaotic, but beneath the surface, price movements follow patterns shaped by activity of larger participants. Institutional investors — hedge funds, banks, high-frequency firms — leave behind distinct footprints that reveal their true intentions. Volume Spread Analysis (VSA) is a powerful method for decoding these signals, allowing those who understand it to align their decisions with forces that truly drive financial markets.

Most strategies focus on price action alone, but volume provides context — a way to determine whether a move is backed by real demand or simply an illusion. Comprehending the bargaining process requires more than just identifying trends; it involves recognizing when institutional players are accumulating positions before a surge or distributing holdings before a major drop.
Fundamentals of Volume Spread Analysis (VSA)
VSA combines three core elements — volume, price spread, closing position — to determine whether market movement is genuine or deceptive.
- Volume: measures the strength of buying and selling pressure. A price increase on low volume suggests weak participation, while a rise backed by heavy volume indicates institutional involvement.
- Price spread: difference between an asset’s high and low during a specific period. Wide spreads with increasing volume often indicate strong buying or selling activity.
- Closing position: where price settles at the end of a period provides insight into market sentiment. If price closes near high on strong volume, it signals aggressive buying; if it closes near low, it suggests distribution.
By analyzing these components together, VSA helps determine whether a trend is real or likely to reverse, providing a deeper knowledge of market dynamics.
Wyckoff’s Theory and Role of Institutional Investors
Richard Wyckoff, a pioneer in market analysis, developed a framework that closely aligns with VSA. His theory categorizes market movements into accumulation, markup, distribution, markdown phases, each controlled by institutional investors.
- Accumulation: large players quietly build positions without triggering price spikes, keeping interest low to avoid attracting attention.
- Markup: after accumulating enough volume, institutions push prices higher, forcing latecomers to chase the move.
- Distribution: positions are offloaded at premium levels while retail participants continue buying, unaware that the uptrend is losing strength.
- Markdown: once distribution is complete, price collapses as institutional players have already exited.
Recognizing these phases early prevents being caught on the wrong side of major market movements.
Identifying Accumulation and Distribution Phases
Spotting accumulation and distribution zones requires volume-based confirmation.
| Signs of accumulation | Signs of distribution |
| Price moves sideways with high volume on down days, low volume on up days | Price remains elevated, but volume spikes during sell-offs signal institutional unloading |
| Downward spikes are met with strong buying, preventing further declines | Upward moves are met with low participation, showing a lack of genuine demand |
| A sudden breakout with an increase in volume confirms the end of accumulation | A sharp breakdown with high volume marks transition to markdown |
Comprehending what is trading as well as these phases prevents buying into traps, helps position ahead of major price shifts.
How to Use VSA for Better Entries and Exits
Volume-based strategies work best when combined with confirmation signals to improve entry and exit accuracy.
| Entry strategies | Exit strategies |
| Buying after a confirmed accumulation breakout, supported by increasing volume | Selling when price approaches distribution levels with declining momentum |
| Entering on a pullback with low volume, showing weak selling pressure | Taking profits when volume divergence appears — rising prices with shrinking volume suggest trend weakness |
| Identifying climactic volume spikes, signaling trend exhaustion and reversals | Exiting during high-volume reversals, as institutional selling pressure increases |
Mastering these techniques reduces risk as well as maximizes profitability, ensuring decisions are aligned with the strongest market forces.
Turning Volume into a Market Advantage
Most retail participants focus on price alone, missing hidden signals left by larger players. VSA provides a structured approach to identifying real accumulation, distribution, trend strength, offering a way to track smart money activity instead of reacting blindly to price fluctuations. Volume confirms whether a move is real or just another market trap. Those who integrate VSA into their strategy gain a clearer, more predictive view of price movement, ensuring they are positioned on the right side of major trends.
Final Thoughts: Trading is a Skill, Not a Gamble
Long-term success in financial markets is never the result of luck. It is built on discipline, knowledge, a structured approach that balances risk with reward. Those who approach market participation as a guessing game often find themselves on the losing side, while those who invest time in mastering strategies, refining their execution stand a much better chance of consistent profitability.
Every decision carries a level of uncertainty, but structured analysis helps reduce randomness. Markets move in cycles, influenced by institutional players, economic data, liquidity shifts. Those who adapt to changing conditions, refine their methods gain a sustainable advantage over time.
Success Comes from Continuous Learning, Disciplined Execution
Financial markets evolve. What worked a decade ago may not work today, strategies that are effective in one environment may fail in another. Success depends on the ability to keep learning, testing, improving execution.
- Analyzing past trades provides insights into strengths as well as weaknesses, refining decision-making over time.
- Knowing economic trends helps anticipate major shifts that influence price movement.
- Developing emotional discipline prevents impulsive decisions driven by fear or greed.
The best market participants treat financial speculation as a business, not a game — each decision is based on calculated probabilities, not gut instinct.
Choosing the Right Strategies, Risk Management Techniques is Crucial
Markets are full of opportunities, but not every setup is worth taking. Selecting a strategy that aligns with risk tolerance along with capital size ensures sustainability.
- Momentum-based approaches work well in trending conditions but struggle in sideways markets.
- Mean reversion techniques thrive when price deviates too far from its historical average but require precise timing.
- Market-neutral strategies such as pair trading reduce directional risk, focus on relative performance.
Even the best strategy fails without proper risk management in learning what is trading. Position sizing, stop-loss placement, capital allocation are non-negotiable elements in building a long-term approach. Those who protect capital first stay in the game long enough to capitalize on the best opportunities.
Adapting to Market Conditions Ensures Long-Term Survival
No strategy works under all conditions. Ability to recognize changing market environments, adjust accordingly separates those who thrive from those who struggle.
- Volatile conditions require wider stop-losses, reduced position sizes.
- Low-liquidity markets demand patience as well as confirmation before entering positions.
- Strong trends favor momentum-following approaches, while ranging markets require mean reversion strategies.
Flexibility ensures survival. Rigid thinking, a refusal to adjust lead to unnecessary losses along with missed opportunities.
Mastering Technical, Fundamental Tools Gives an Edge
Combining multiple forms of analysis increases decision-making accuracy. Technical indicators highlight momentum, support, resistance, while fundamental data reveals underlying forces driving price movement.
- Volume-based strategies confirm whether price action is backed by institutional interest.
- Divergence analysis detects potential reversals before they happen.
- Liquidity-based approaches identify key accumulation and distribution zones.
Knowledge is cumulative. The deeper the comprehension of market structure, order flow, sentiment analysis, the greater the edge over those who rely solely on intuition.
Mastery Comes from Patience, Strategy, Execution
Sustained success is never about finding a "perfect system" — it’s about developing skills, managing risk, executing consistently. Knowing what is trading means recognizing that losses are part of the process, but those who refine their approach, control their emotions, continuously adapt as well as position themselves for long-term profitability. Markets will always provide opportunities — only those who are prepared will know how to take advantage of them.


