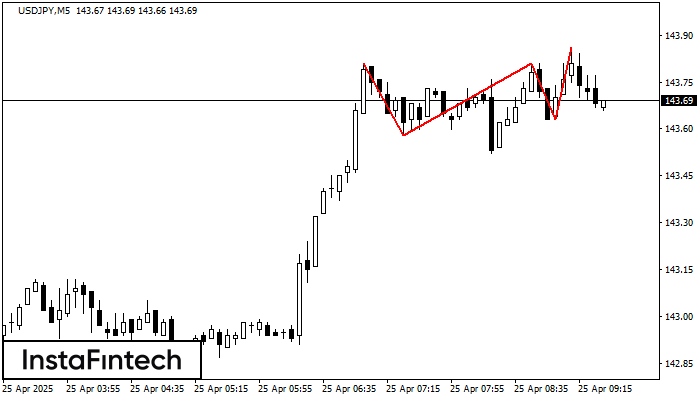
Triple Top
was formed on 25.04 at 08:30:10 (UTC+0)
signal strength 1 of 5

On the chart of the USDJPY M5 trading instrument, the Triple Top pattern that signals a trend change has formed. It is possible that after formation of the third peak, the price will try to break through the resistance level 143.58, where we advise to open a trading position for sale. Take profit is the projection of the pattern’s width, which is 23 points.
The M5 and M15 time frames may have more false entry points.
- All
- All
- Bearish Rectangle
- Bearish Symmetrical Triangle
- Bearish Symmetrical Triangle
- Bullish Rectangle
- Double Top
- Double Top
- Triple Bottom
- Triple Bottom
- Triple Top
- Triple Top
- All
- All
- Buy
- Sale
- All
- 1
- 2
- 3
- 4
- 5
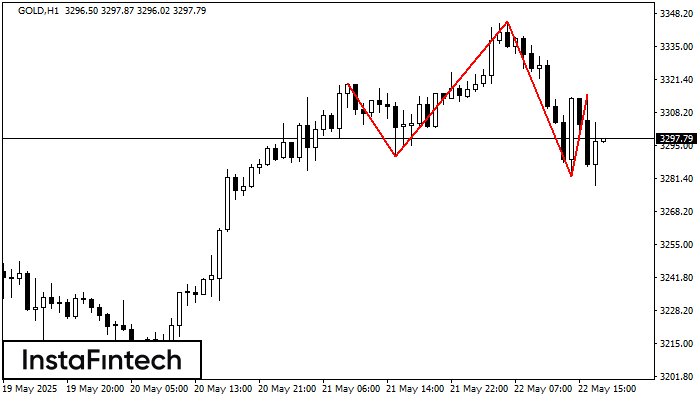
হেড অ্যান্ড শোল্ডার্স
was formed on 22.05 at 17:00:26 (UTC+0)
signal strength 4 of 5
H1 চার্টে, GOLD নিম্নলিখিত ফিচারগুলোর সাথে হেড অ্যান্ড শোল্ডার্স প্যাটার্ন তৈরি করেছে: হেডের টপ 3344.99, নেকলাইন এবং ঊর্ধ্বমুখী অ্যাঙ্গেল 3290.48/3282.56-এ রয়েছে। এই প্যাটার্নের গঠন বর্তমান প্রবণতা বুলিশ থেকে বিয়ারিশে পরিবর্তন
Open chart in a new window
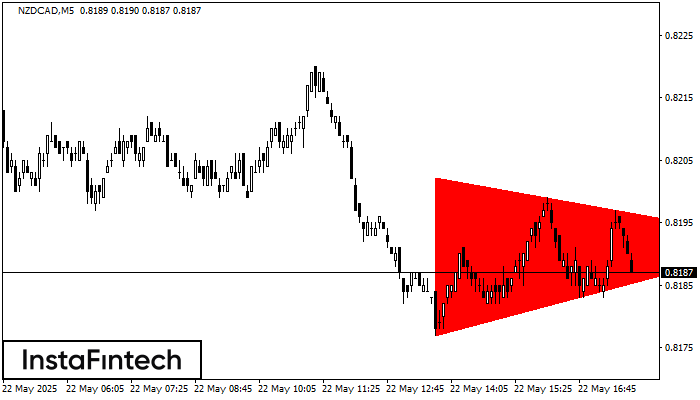
বিয়ারিশ সিমেট্রিক্যাল ট্রায়াঙ্গেল
was formed on 22.05 at 16:50:59 (UTC+0)
signal strength 1 of 5
M5 চার্ট অনুযায়ী, NZDCAD বিয়ারিশ সিমেট্রিক্যাল ট্রায়াঙ্গেল প্যাটার্ন গঠন করেছে। বর্ণনা: নীচের সীমানা হচ্ছে 0.8177/0.8192 এবং উপরের সীমানা হল 0.8202/0.8192৷ চার্টে প্যাটার্নের প্রস্থ -25 পিপস বলে পরিমাপ করা হয়েছে। বিয়ারিশ
M5 এবং M15 টাইম ফ্রেমে আরও ভুল এন্ট্রি পয়েন্ট থাকতে পারে।
Open chart in a new window
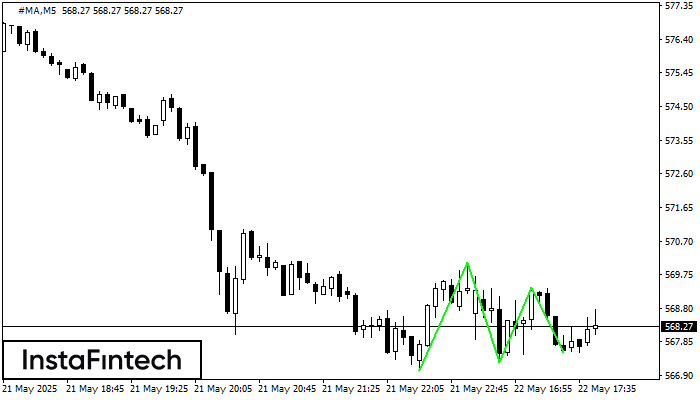
ট্রিপল বটম
was formed on 22.05 at 16:50:25 (UTC+0)
signal strength 1 of 5
M5 চার্টে #MA-এর ট্রিপল বটম প্যাটার্নটি গঠিত হয়েছে। এই প্যাটার্নের নিম্নলিখিত বৈশিষ্ট্য রয়েছে: রেজিস্ট্যান্স স্তর 570.10/569.39; সাপোর্ট স্তর 567.05/567.54; প্রস্থ হল 305 পয়েন্ট। 570.10-এর রেজিস্ট্যান্স স্তর ব্রেক করা ঘটলে, মূল্য
M5 এবং M15 টাইম ফ্রেমে আরও ভুল এন্ট্রি পয়েন্ট থাকতে পারে।
Open chart in a new window


