

অ্যাকচুয়াল প্যাটার্নস

প্যাটার্ন হলো গ্রাফিক্যাল মডেল, যা মূল্য ওঠানামার ভিত্তিতে চার্টে তৈরি হয়। টেকনিক্যাল বিশ্লেষণের নীতি অনুযায়ী, ইতিহাসের (প্রাইস মুভমেন্ট) পুনরাবৃত্তি ঘটে। অর্থাৎ, পরিস্থিতি যদি একই রকম থাকে তাহলে প্রাইস মুভমেন্টও প্রায় একই রকম হয়। এর ফলে মূল্যের ওঠানামা কেমন হবে তা আগেই থেকেই অনুমান করা যায়।
ইন্সটাফরেক্স এর প্রাসঙ্গিক প্যাটার্নসমূহ সহজেই ব্যবহার করা যায়, যার মাধ্যমে মার্কেটের সর্বশেষ পরিস্থিতি জানা যায় এবং তার উপর ভিত্তি করে সিদ্ধান্ত নেওয়া যায়। আমাদের সেবাগুলো থেকে আপনি যেকোনো পেয়ার এবং টাইমফ্রেমের জন্য সর্বশেষ এবং সবচেয়ে প্রাসঙ্গিক প্যাটার্নগুলো খুঁজে পাবেন।
Inverse Head and Shoulder
was formed on 25.04 at 08:30:00 (UTC+0)
signal strength 2 of 5
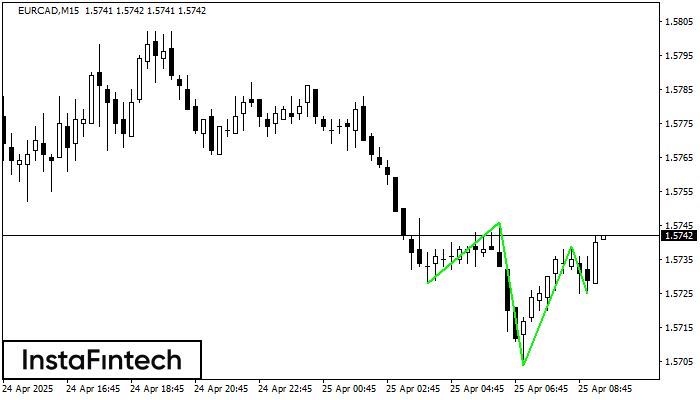
According to M15, EURCAD is shaping the technical pattern – the Inverse Head and Shoulder. In case the Neckline 1.5746/1.5739 is broken out, the instrument is likely to move toward 1.5761.
The M5 and M15 time frames may have more false entry points.
আরও দেখুন
- All
- All
- Bearish Rectangle
- Bearish Symmetrical Triangle
- Bearish Symmetrical Triangle
- Bullish Rectangle
- Double Top
- Double Top
- Triple Bottom
- Triple Bottom
- Triple Top
- Triple Top
- All
- All
- Buy
- Sale
- All
- 1
- 2
- 3
- 4
- 5
ডাবল বটম
was formed on 30.05 at 09:30:30 (UTC+0)
signal strength 1 of 5
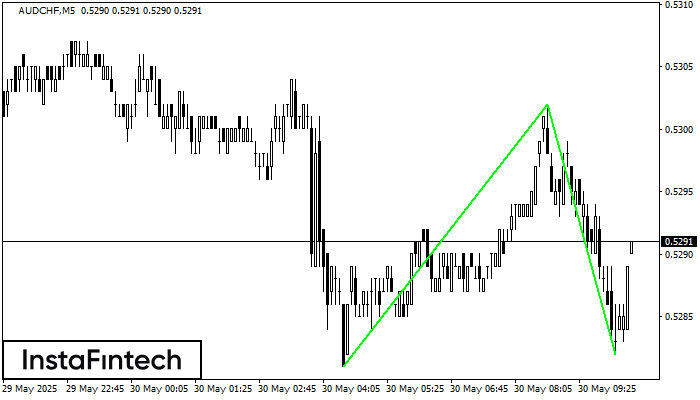
M5 চার্টে, AUDCHF-এর ডাবল বটম প্যাটার্নটি গঠিত হয়েছে। বৈশিষ্ট্য: সাপোর্ট স্তর হচ্ছে 0.5281; রেজিস্ট্যান্স স্তর হচ্ছে 0.5302; প্যাটার্নের প্রস্থ হচ্ছে 21 পয়েন্ট। রেজিস্ট্যান্স স্তর ভেদ করা হলে, 20 পয়েন্টের দূরত্বে
M5 এবং M15 টাইম ফ্রেমে আরও ভুল এন্ট্রি পয়েন্ট থাকতে পারে।
Open chart in a new window
ডাবল বটম
was formed on 30.05 at 09:30:14 (UTC+0)
signal strength 2 of 5
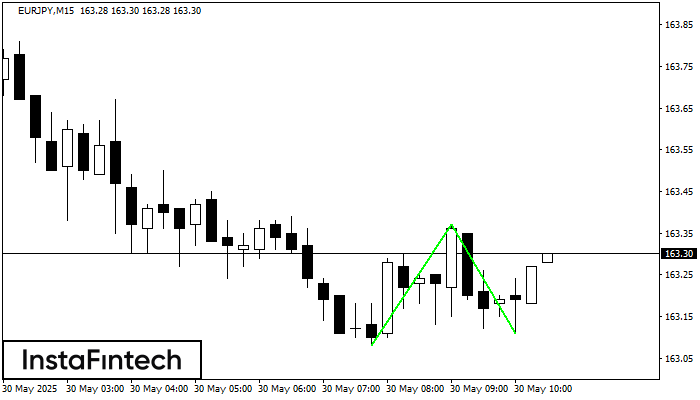
M15 চার্টে, EURJPY-এর ডাবল বটম প্যাটার্নটি গঠিত হয়েছে। বৈশিষ্ট্য: সাপোর্ট স্তর হচ্ছে 163.08; রেজিস্ট্যান্স স্তর হচ্ছে 163.37; প্যাটার্নের প্রস্থ হচ্ছে 29 পয়েন্ট। রেজিস্ট্যান্স স্তর ভেদ করা হলে, 26 পয়েন্টের দূরত্বে
M5 এবং M15 টাইম ফ্রেমে আরও ভুল এন্ট্রি পয়েন্ট থাকতে পারে।
Open chart in a new window
ট্রিপল বটম
was formed on 30.05 at 09:00:12 (UTC+0)
signal strength 4 of 5
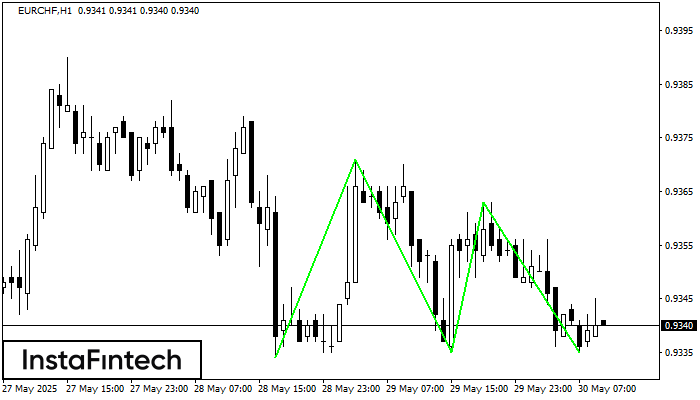
H1 চার্টে EURCHF-এর ট্রিপল বটম প্যাটার্নটি গঠিত হয়েছে। প্যাটার্নের বৈশিষ্ট্য: প্যাটার্নের নীচের লাইনে কোঅর্ডিনেট 0.9371 রয়েছে এবং এটির উপরের সীমা 0.9371/0.9363, প্রস্থের প্রজেকশন হল 37 পয়েন্ট। ট্রিপল বটম প্যাটার্নের
Open chart in a new window


