

অ্যাকচুয়াল প্যাটার্নস

প্যাটার্ন হলো গ্রাফিক্যাল মডেল, যা মূল্য ওঠানামার ভিত্তিতে চার্টে তৈরি হয়। টেকনিক্যাল বিশ্লেষণের নীতি অনুযায়ী, ইতিহাসের (প্রাইস মুভমেন্ট) পুনরাবৃত্তি ঘটে। অর্থাৎ, পরিস্থিতি যদি একই রকম থাকে তাহলে প্রাইস মুভমেন্টও প্রায় একই রকম হয়। এর ফলে মূল্যের ওঠানামা কেমন হবে তা আগেই থেকেই অনুমান করা যায়।
ইন্সটাফরেক্স এর প্রাসঙ্গিক প্যাটার্নসমূহ সহজেই ব্যবহার করা যায়, যার মাধ্যমে মার্কেটের সর্বশেষ পরিস্থিতি জানা যায় এবং তার উপর ভিত্তি করে সিদ্ধান্ত নেওয়া যায়। আমাদের সেবাগুলো থেকে আপনি যেকোনো পেয়ার এবং টাইমফ্রেমের জন্য সর্বশেষ এবং সবচেয়ে প্রাসঙ্গিক প্যাটার্নগুলো খুঁজে পাবেন।
Triple Top
was formed on 23.04 at 21:10:21 (UTC+0)
signal strength 1 of 5
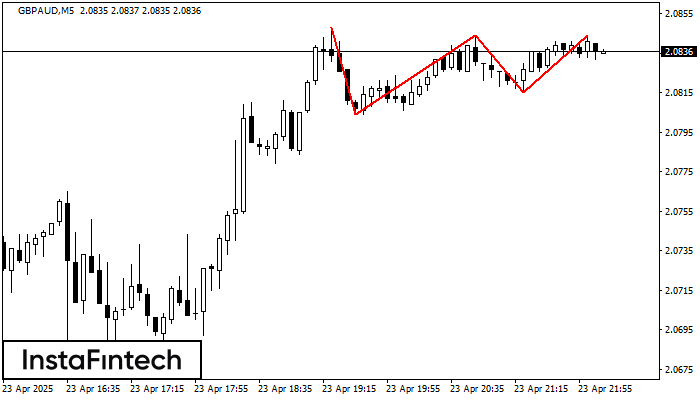
The Triple Top pattern has formed on the chart of the GBPAUD M5. Features of the pattern: borders have an ascending angle; the lower line of the pattern has the coordinates 2.0804/2.0815 with the upper limit 2.0848/2.0844; the projection of the width is 44 points. The formation of the Triple Top figure most likely indicates a change in the trend from upward to downward. This means that in the event of a breakdown of the support level of 2.0804, the price is most likely to continue the downward movement.
The M5 and M15 time frames may have more false entry points.
আরও দেখুন
- All
- All
- Bearish Rectangle
- Bearish Symmetrical Triangle
- Bearish Symmetrical Triangle
- Bullish Rectangle
- Double Top
- Double Top
- Triple Bottom
- Triple Bottom
- Triple Top
- Triple Top
- All
- All
- Buy
- Sale
- All
- 1
- 2
- 3
- 4
- 5
รูปแบบสามเหลี่ยมสมมาตรขาขึ้น (Bullish Symmetrical Triangle)
was formed on 22.09 at 20:17:21 (UTC+0)
signal strength 2 of 5
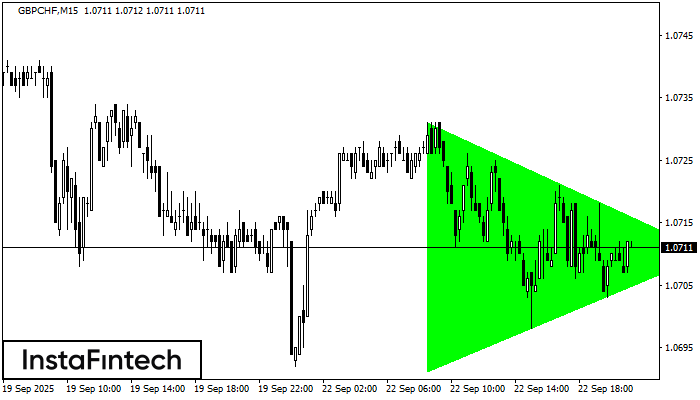
อ้างอิงจากชาร์ตของ M15, GBPCHF ที่ได้สร้างรูปแบบ รูปแบบสามเหลี่ยมสมมาตรขาขึ้น (Bullish Symmetrical Triangle) ออกมา คำอธิบาย: นี้คือรูปแบบของความต่อเนื่องในแนวโน้ม 1.0731 และ 1.0691 เป็นพิกัดของขอบเขตด้านบนและด้านล่าง
ขอบเตระยะเวลาใน M5 และ M15 อาจจะมีตำแหน่งการเข้าใช้งานที่ผิดพลาดมากยิ่งขึ้น
Open chart in a new window
รูปแบบกราฟธงปลายแหลมขาขึ้น (Bullish pennant)
was formed on 22.09 at 17:45:07 (UTC+0)
signal strength 2 of 5
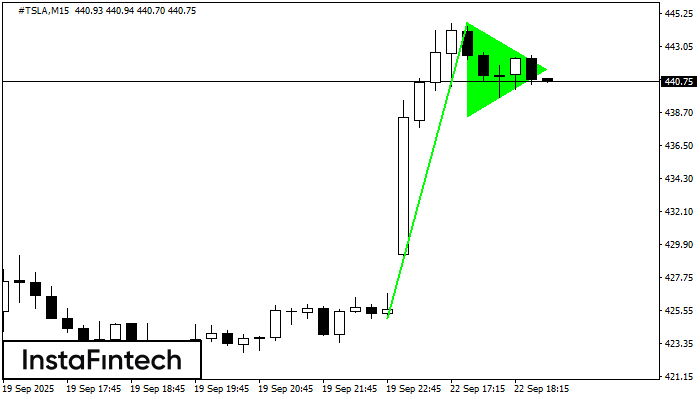
รูปแบบ รูปแบบกราฟธงปลายแหลมขาขึ้น (Bullish pennant) ได้ถูกสร้างขึ้นมาในชาร์ต #TSLA M15 มันเป็นประเภทของรูปแบบต่อเนื่อง ตามที่คาดไว้ กรณีที่ราคาทรงตัวอยุ่สูงกว่าระดับสูงสุดของกราฟรูปธงปลายแหลมที่ 444.70 ก็อาจจะมีแนวโน้มขาขึ้นต่อไป
ขอบเตระยะเวลาใน M5 และ M15 อาจจะมีตำแหน่งการเข้าใช้งานที่ผิดพลาดมากยิ่งขึ้น
Open chart in a new window
รูปแบบกราฟจุดสองยอดขาลง (Double Bottom)
was formed on 22.09 at 16:00:27 (UTC+0)
signal strength 3 of 5
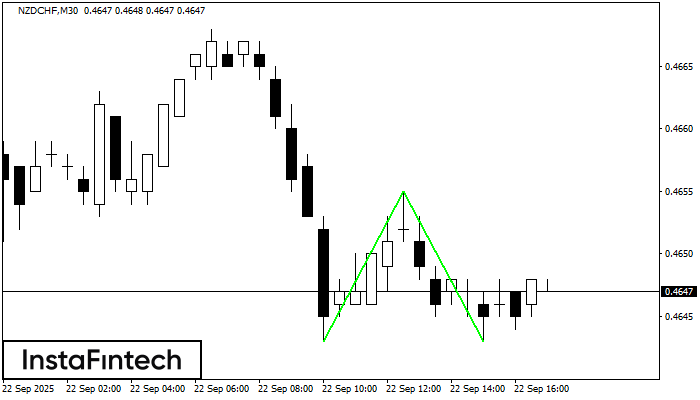
รูปแบบ รูปแบบกราฟจุดสองยอดขาลง (Double Bottom) ถูกสร้างขึ้นมาใน NZDCHF M30; ขอบเขตด้านบนอยู่ที่ 0.4655;ขอบเขตด้านล่าง คือ 0.4643 ความกว้างของรูปแบบนี้คือ 12 จุด กรณีที่มีการเคลื่อนตัวทะลุผ่านขอบเขตด้านบน
Open chart in a new window


