

অ্যাকচুয়াল প্যাটার্নস

প্যাটার্ন হলো গ্রাফিক্যাল মডেল, যা মূল্য ওঠানামার ভিত্তিতে চার্টে তৈরি হয়। টেকনিক্যাল বিশ্লেষণের নীতি অনুযায়ী, ইতিহাসের (প্রাইস মুভমেন্ট) পুনরাবৃত্তি ঘটে। অর্থাৎ, পরিস্থিতি যদি একই রকম থাকে তাহলে প্রাইস মুভমেন্টও প্রায় একই রকম হয়। এর ফলে মূল্যের ওঠানামা কেমন হবে তা আগেই থেকেই অনুমান করা যায়।
ইন্সটাফরেক্স এর প্রাসঙ্গিক প্যাটার্নসমূহ সহজেই ব্যবহার করা যায়, যার মাধ্যমে মার্কেটের সর্বশেষ পরিস্থিতি জানা যায় এবং তার উপর ভিত্তি করে সিদ্ধান্ত নেওয়া যায়। আমাদের সেবাগুলো থেকে আপনি যেকোনো পেয়ার এবং টাইমফ্রেমের জন্য সর্বশেষ এবং সবচেয়ে প্রাসঙ্গিক প্যাটার্নগুলো খুঁজে পাবেন।
Bearish Symmetrical Triangle
was formed on 23.04 at 15:34:19 (UTC+0)
signal strength 1 of 5
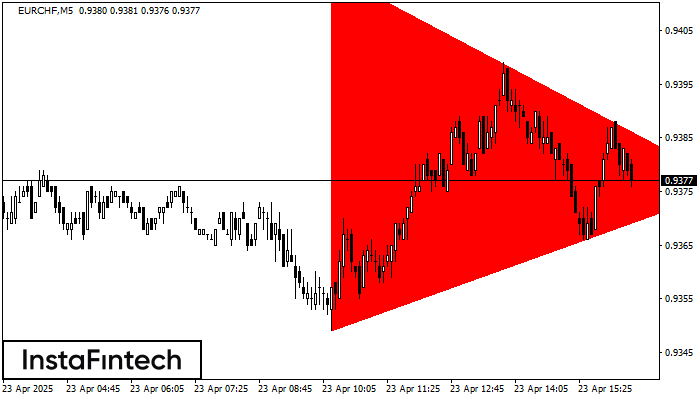
According to the chart of M5, EURCHF formed the Bearish Symmetrical Triangle pattern. Description: The lower border is 0.9349/0.9376 and upper border is 0.9416/0.9376. The pattern width is measured on the chart at -67 pips. The formation of the Bearish Symmetrical Triangle pattern evidently signals a continuation of the downward trend. In other words, if the scenario comes true and EURCHF breaches the lower border, the price could continue its move toward 0.9361.
The M5 and M15 time frames may have more false entry points.
আরও দেখুন
- All
- All
- Bearish Rectangle
- Bearish Symmetrical Triangle
- Bearish Symmetrical Triangle
- Bullish Rectangle
- Double Top
- Double Top
- Triple Bottom
- Triple Bottom
- Triple Top
- Triple Top
- All
- All
- Buy
- Sale
- All
- 1
- 2
- 3
- 4
- 5
बुलिश फ्लैग
was formed on 29.05 at 01:05:37 (UTC+0)
signal strength 1 of 5
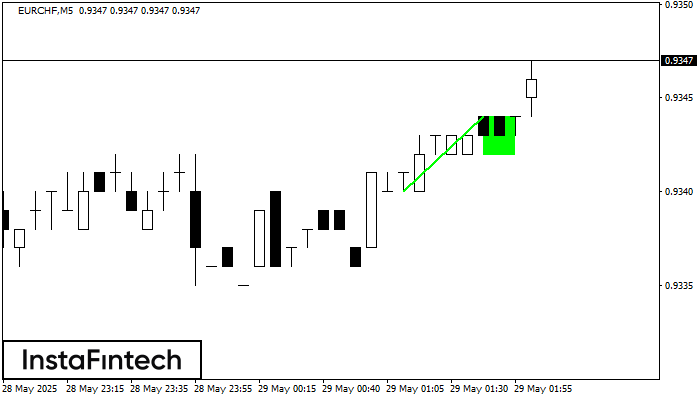
बुलिश फ्लैग पैटर्न EURCHF M5 चार्ट पर बनाया गया है जो दर्शाता है कि ऊपर की ओर रुझान जारी रहेगा। संकेत: 0.9344 पर शिखर के टूटने से कीमत अधिक हो
M5 और M15 समय सीमा में अधिक फाल्स एंट्री पॉइंट्स हो सकते हैं।
Open chart in a new window
बियरिश आयत
was formed on 29.05 at 01:02:33 (UTC+0)
signal strength 2 of 5
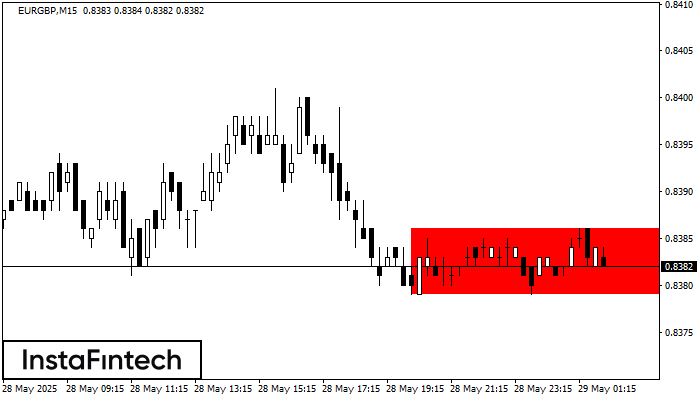
M15 के चार्ट के अनुसार, EURGBP से बियरिश आयत बना। इस प्रकार का पैटर्न एक प्रवृत्ति निरंतरता को इंगित करता है। इसमें दो स्तर होते हैं: प्रतिरोध 0.8386 - 0.0000
M5 और M15 समय सीमा में अधिक फाल्स एंट्री पॉइंट्स हो सकते हैं।
Open chart in a new window
डबल बॉटम
was formed on 29.05 at 00:31:19 (UTC+0)
signal strength 3 of 5
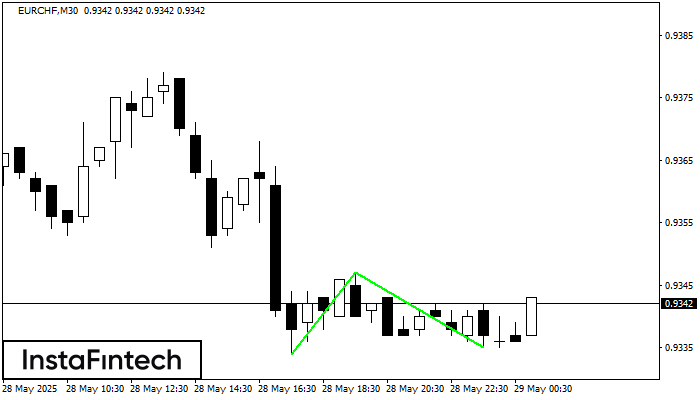
डबल बॉटम पैटर्न EURCHF M30 पर बना है; ऊपरी सीमा 0.9347 है; निचली सीमा 0.9335 है। पैटर्न की चौड़ाई 13 अंक है। ऊपरी सीमा 0.9347 के टूटने के मामले में
Open chart in a new window


