

অ্যাকচুয়াল প্যাটার্নস

প্যাটার্ন হলো গ্রাফিক্যাল মডেল, যা মূল্য ওঠানামার ভিত্তিতে চার্টে তৈরি হয়। টেকনিক্যাল বিশ্লেষণের নীতি অনুযায়ী, ইতিহাসের (প্রাইস মুভমেন্ট) পুনরাবৃত্তি ঘটে। অর্থাৎ, পরিস্থিতি যদি একই রকম থাকে তাহলে প্রাইস মুভমেন্টও প্রায় একই রকম হয়। এর ফলে মূল্যের ওঠানামা কেমন হবে তা আগেই থেকেই অনুমান করা যায়।
ইন্সটাফরেক্স এর প্রাসঙ্গিক প্যাটার্নসমূহ সহজেই ব্যবহার করা যায়, যার মাধ্যমে মার্কেটের সর্বশেষ পরিস্থিতি জানা যায় এবং তার উপর ভিত্তি করে সিদ্ধান্ত নেওয়া যায়। আমাদের সেবাগুলো থেকে আপনি যেকোনো পেয়ার এবং টাইমফ্রেমের জন্য সর্বশেষ এবং সবচেয়ে প্রাসঙ্গিক প্যাটার্নগুলো খুঁজে পাবেন।
Bullish Flag
was formed on 17.04 at 09:47:17 (UTC+0)
signal strength 1 of 5

The Bullish Flag pattern has been formed on NZDCHF at M5. The lower boundary of the pattern is located at 0.4839/0.4829, while the higher boundary lies at 0.4849/0.4839. The projection of the flagpole is 26 points. This formation signals that the upward trend is most likely to continue. Therefore, if the level of 0.4849 is broken, the price will move further upwards.
The M5 and M15 time frames may have more false entry points.
- All
- All
- Bearish Rectangle
- Bearish Symmetrical Triangle
- Bearish Symmetrical Triangle
- Bullish Rectangle
- Double Top
- Double Top
- Triple Bottom
- Triple Bottom
- Triple Top
- Triple Top
- All
- All
- Buy
- Sale
- All
- 1
- 2
- 3
- 4
- 5
Double Top
was formed on 05.06 at 15:30:37 (UTC+0)
signal strength 2 of 5
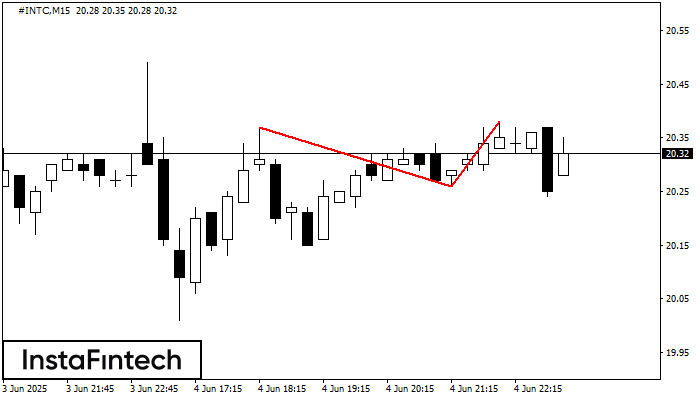
The Double Top pattern has been formed on #INTC M15. It signals that the trend has been changed from upwards to downwards. Probably, if the base of the pattern 20.26
The M5 and M15 time frames may have more false entry points.
Open chart in a new window
Double Bottom
was formed on 05.06 at 15:00:20 (UTC+0)
signal strength 4 of 5
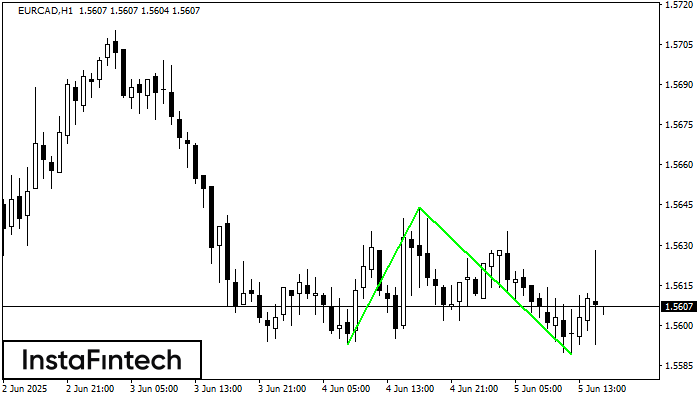
The Double Bottom pattern has been formed on EURCAD H1; the upper boundary is 1.5644; the lower boundary is 1.5589. The width of the pattern is 51 points. In case
Open chart in a new window
Double Top
was formed on 05.06 at 14:30:23 (UTC+0)
signal strength 2 of 5
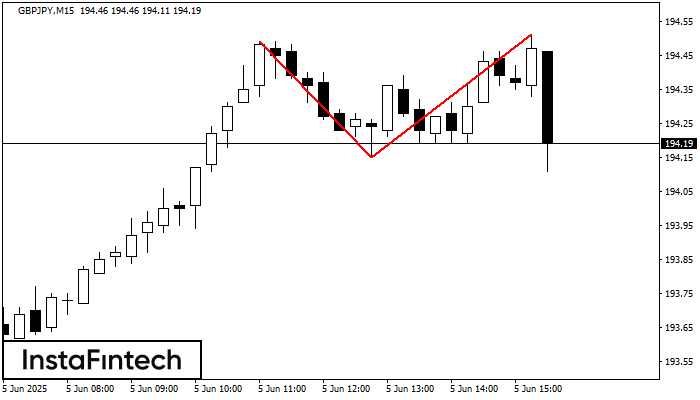
The Double Top reversal pattern has been formed on GBPJPY M15. Characteristics: the upper boundary 194.49; the lower boundary 194.15; the width of the pattern is 36 points. Sell trades
The M5 and M15 time frames may have more false entry points.
Open chart in a new window


