

অ্যাকচুয়াল প্যাটার্নস

প্যাটার্ন হলো গ্রাফিক্যাল মডেল, যা মূল্য ওঠানামার ভিত্তিতে চার্টে তৈরি হয়। টেকনিক্যাল বিশ্লেষণের নীতি অনুযায়ী, ইতিহাসের (প্রাইস মুভমেন্ট) পুনরাবৃত্তি ঘটে। অর্থাৎ, পরিস্থিতি যদি একই রকম থাকে তাহলে প্রাইস মুভমেন্টও প্রায় একই রকম হয়। এর ফলে মূল্যের ওঠানামা কেমন হবে তা আগেই থেকেই অনুমান করা যায়।
ইন্সটাফরেক্স এর প্রাসঙ্গিক প্যাটার্নসমূহ সহজেই ব্যবহার করা যায়, যার মাধ্যমে মার্কেটের সর্বশেষ পরিস্থিতি জানা যায় এবং তার উপর ভিত্তি করে সিদ্ধান্ত নেওয়া যায়। আমাদের সেবাগুলো থেকে আপনি যেকোনো পেয়ার এবং টাইমফ্রেমের জন্য সর্বশেষ এবং সবচেয়ে প্রাসঙ্গিক প্যাটার্নগুলো খুঁজে পাবেন।
Double Top
was formed on 15.04 at 08:30:13 (UTC+0)
signal strength 3 of 5
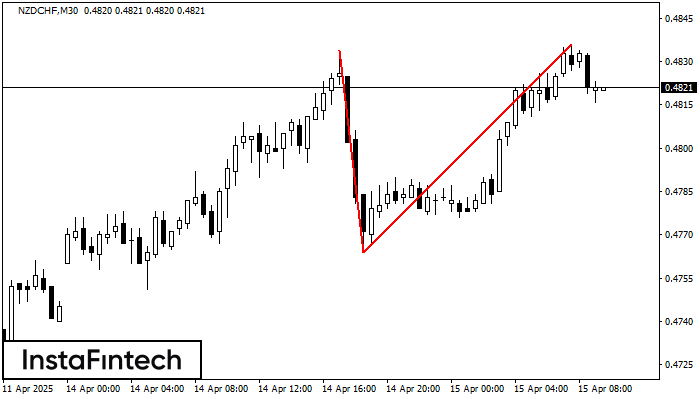
On the chart of NZDCHF M30 the Double Top reversal pattern has been formed. Characteristics: the upper boundary 0.4836; the lower boundary 0.4764; the width of the pattern 72 points. The signal: a break of the lower boundary will cause continuation of the downward trend targeting the 0.4734 level.
- All
- All
- Bearish Rectangle
- Bearish Symmetrical Triangle
- Bearish Symmetrical Triangle
- Bullish Rectangle
- Double Top
- Double Top
- Triple Bottom
- Triple Bottom
- Triple Top
- Triple Top
- All
- All
- Buy
- Sale
- All
- 1
- 2
- 3
- 4
- 5
বুলিশ সিমেট্রিকাল ট্রায়াঙ্গেল
was formed on 24.05 at 18:46:25 (UTC+0)
signal strength 2 of 5

M15 চার্ট অনুসারে, #Bitcoin বুলিশ সিমেট্রিকাল ট্রায়াঙ্গেল প্যাটার্ন গঠন করেছে, যা চলমান প্রবণতা অব্যাহত থাকবে বলে ইঙ্গিত দিচ্ছে। বর্ণনা: প্যাটার্নের উপরের সীমানা 109440.14/108872.57-এর কোঅর্ডিনেটগুলো স্পর্শ করেছে যেখানে নীচের সীমানা 108311.13/108872.57
M5 এবং M15 টাইম ফ্রেমে আরও ভুল এন্ট্রি পয়েন্ট থাকতে পারে।
Open chart in a new window
বিয়ারিশ রেক্ট্যাঙ্গেল
was formed on 23.05 at 23:00:20 (UTC+0)
signal strength 1 of 5

M5 চার্ট অনুযায়ী, EURNZD বিয়ারিশ রেক্ট্যাঙ্গেল গঠন করেছে। এই প্যাটার্ন চলমান প্রবণতার ধারাবাহিকতা নির্দেশ করে। উপরের সীমানা হল 1.8982, নীচের সীমানা হল 1.8964৷ এই সংকেতের অর্থ হল বিয়ারিশ রেক্ট্যাঙ্গেল-এর নীচের
M5 এবং M15 টাইম ফ্রেমে আরও ভুল এন্ট্রি পয়েন্ট থাকতে পারে।
Open chart in a new window
বুলিশ সিমেট্রিকাল ট্রায়াঙ্গেল
was formed on 23.05 at 22:14:53 (UTC+0)
signal strength 1 of 5

M5 চার্ট অনুযায়ী, AUDCHF বুলিশ সিমেট্রিকাল ট্রায়াঙ্গেল প্যাটার্ন গঠন করেছে। বর্ণনা: এটি একটি ধারাবাহিক প্রবণতার প্যাটার্ন। 0.5335 এবং 0.5329 হল যথাক্রমে উপরের এবং নীচের সীমানার কোঅর্ডিনেট। চার্টে প্যাটার্নের প্রস্থ
M5 এবং M15 টাইম ফ্রেমে আরও ভুল এন্ট্রি পয়েন্ট থাকতে পারে।
Open chart in a new window


