

অ্যাকচুয়াল প্যাটার্নস

প্যাটার্ন হলো গ্রাফিক্যাল মডেল, যা মূল্য ওঠানামার ভিত্তিতে চার্টে তৈরি হয়। টেকনিক্যাল বিশ্লেষণের নীতি অনুযায়ী, ইতিহাসের (প্রাইস মুভমেন্ট) পুনরাবৃত্তি ঘটে। অর্থাৎ, পরিস্থিতি যদি একই রকম থাকে তাহলে প্রাইস মুভমেন্টও প্রায় একই রকম হয়। এর ফলে মূল্যের ওঠানামা কেমন হবে তা আগেই থেকেই অনুমান করা যায়।
ইন্সটাফরেক্স এর প্রাসঙ্গিক প্যাটার্নসমূহ সহজেই ব্যবহার করা যায়, যার মাধ্যমে মার্কেটের সর্বশেষ পরিস্থিতি জানা যায় এবং তার উপর ভিত্তি করে সিদ্ধান্ত নেওয়া যায়। আমাদের সেবাগুলো থেকে আপনি যেকোনো পেয়ার এবং টাইমফ্রেমের জন্য সর্বশেষ এবং সবচেয়ে প্রাসঙ্গিক প্যাটার্নগুলো খুঁজে পাবেন।
Double Top
was formed on 15.04 at 02:00:21 (UTC+0)
signal strength 4 of 5
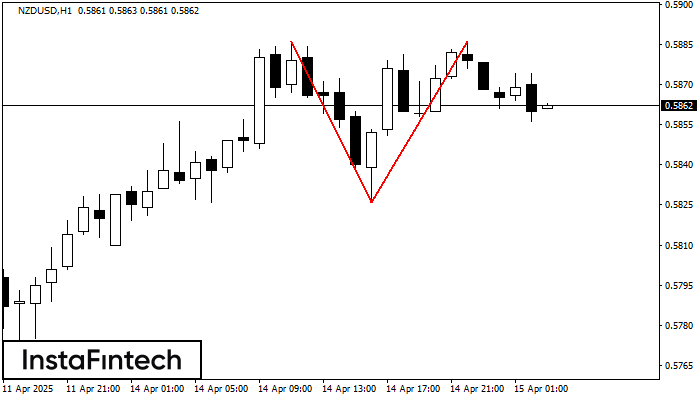
The Double Top pattern has been formed on NZDUSD H1. It signals that the trend has been changed from upwards to downwards. Probably, if the base of the pattern 0.5826 is broken, the downward movement will continue.
- All
- All
- Bearish Rectangle
- Bearish Symmetrical Triangle
- Bearish Symmetrical Triangle
- Bullish Rectangle
- Double Top
- Double Top
- Triple Bottom
- Triple Bottom
- Triple Top
- Triple Top
- All
- All
- Buy
- Sale
- All
- 1
- 2
- 3
- 4
- 5
Bearish Symmetrical Triangle
сформирован 16.05 в 00:51:30 (UTC+0)
сила сигнала 2 из 5
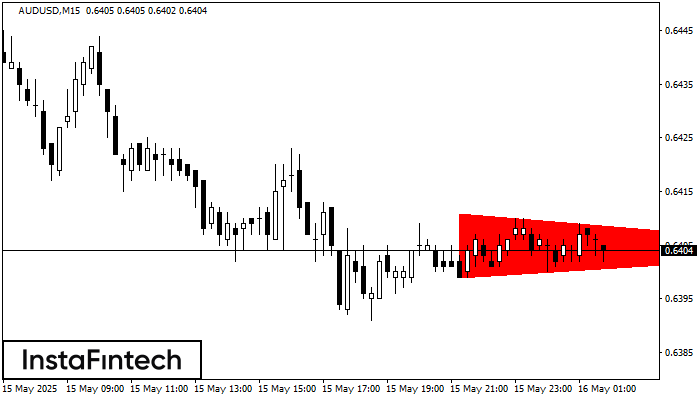
According to the chart of M15, AUDUSD formed the Bearish Symmetrical Triangle pattern. Trading recommendations: A breach of the lower border 0.6399 is likely to encourage a continuation
The M5 and M15 time frames may have more false entry points.
Открыть график инструмента в новом окне
Bearish Symmetrical Triangle
сформирован 16.05 в 00:00:32 (UTC+0)
сила сигнала 1 из 5

According to the chart of M5, EURJPY formed the Bearish Symmetrical Triangle pattern. Trading recommendations: A breach of the lower border 162.73 is likely to encourage a continuation
The M5 and M15 time frames may have more false entry points.
Открыть график инструмента в новом окне
Bearish Symmetrical Triangle
сформирован 15.05 в 23:00:07 (UTC+0)
сила сигнала 1 из 5
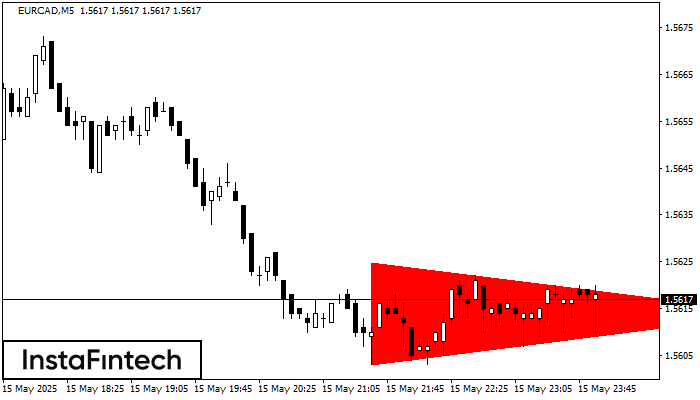
According to the chart of M5, EURCAD formed the Bearish Symmetrical Triangle pattern. Trading recommendations: A breach of the lower border 1.5603 is likely to encourage a continuation
The M5 and M15 time frames may have more false entry points.
Открыть график инструмента в новом окне


