

অ্যাকচুয়াল প্যাটার্নস

প্যাটার্ন হলো গ্রাফিক্যাল মডেল, যা মূল্য ওঠানামার ভিত্তিতে চার্টে তৈরি হয়। টেকনিক্যাল বিশ্লেষণের নীতি অনুযায়ী, ইতিহাসের (প্রাইস মুভমেন্ট) পুনরাবৃত্তি ঘটে। অর্থাৎ, পরিস্থিতি যদি একই রকম থাকে তাহলে প্রাইস মুভমেন্টও প্রায় একই রকম হয়। এর ফলে মূল্যের ওঠানামা কেমন হবে তা আগেই থেকেই অনুমান করা যায়।
ইন্সটাফরেক্স এর প্রাসঙ্গিক প্যাটার্নসমূহ সহজেই ব্যবহার করা যায়, যার মাধ্যমে মার্কেটের সর্বশেষ পরিস্থিতি জানা যায় এবং তার উপর ভিত্তি করে সিদ্ধান্ত নেওয়া যায়। আমাদের সেবাগুলো থেকে আপনি যেকোনো পেয়ার এবং টাইমফ্রেমের জন্য সর্বশেষ এবং সবচেয়ে প্রাসঙ্গিক প্যাটার্নগুলো খুঁজে পাবেন।
Triple Top
was formed on 14.04 at 22:30:39 (UTC+0)
signal strength 3 of 5
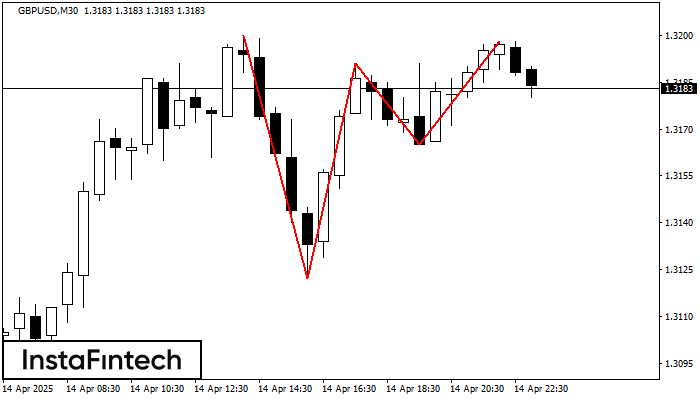
The Triple Top pattern has formed on the chart of the GBPUSD M30 trading instrument. It is a reversal pattern featuring the following characteristics: resistance level 2, support level -43, and pattern’s width 78. Forecast If the price breaks through the support level 1.3122, it is likely to move further down to 1.3161.
আরও দেখুন
- All
- All
- Bearish Rectangle
- Bearish Symmetrical Triangle
- Bearish Symmetrical Triangle
- Bullish Rectangle
- Double Top
- Double Top
- Triple Bottom
- Triple Bottom
- Triple Top
- Triple Top
- All
- All
- Buy
- Sale
- All
- 1
- 2
- 3
- 4
- 5
ট্রিপল টপ
was formed on 30.05 at 22:20:23 (UTC+0)
signal strength 1 of 5

M5 চার্টে, GOLD ট্রেডিং ইন্সট্রুমেন্টের ট্রিপল টপ প্যাটার্ন গঠিত হয়েছে। এটি একটি রিভার্সাল বা বিপরীতমুখী প্যাটার্ন যা নিম্নলিখিত বৈশিষ্ট্যগুলিকে সমন্বিত করে: রেজিস্ট্যান্স স্তর 4, সাপোর্ট স্তর -193 এবং প্যাটার্নের প্রস্থ
M5 এবং M15 টাইম ফ্রেমে আরও ভুল এন্ট্রি পয়েন্ট থাকতে পারে।
Open chart in a new window
ইনভার্স হেড অ্যান্ড শোল্ডার্স
was formed on 30.05 at 21:50:24 (UTC+0)
signal strength 1 of 5

M5 চার্ট অনুযায়ী, #AMZN-এর ইনভার্স হেড অ্যান্ড শোল্ডার্স প্যাটার্ন গঠিত হয়েছে। হেড 201.64 -এ নির্ধারণ করা হয়েছে এবং নেকের মিডিয়ান লাইন 204.52/205.01 -এ নির্ধারণ করা হয়েছে। ইনভার্স হেড অ্যান্ড শোল্ডার্স
M5 এবং M15 টাইম ফ্রেমে আরও ভুল এন্ট্রি পয়েন্ট থাকতে পারে।
Open chart in a new window
বিয়ারিশ রেক্ট্যাঙ্গেল
was formed on 30.05 at 21:36:36 (UTC+0)
signal strength 1 of 5

M5 চার্ট অনুসারে, GBPAUD বিয়ারিশ রেক্ট্যাঙ্গেল গঠন করেছে যা চলমান প্রবণতার ধারাবাহিকতার প্যাটার্ন। প্যাটার্নটি নিম্নলিখিত সীমানার মধ্যে রয়েছে: নীচের সীমানা 2.0897 – 2.0897 এবং উপরের সীমানা 2.0908 – 2.0908৷ নীচের
M5 এবং M15 টাইম ফ্রেমে আরও ভুল এন্ট্রি পয়েন্ট থাকতে পারে।
Open chart in a new window


