

অ্যাকচুয়াল প্যাটার্নস

প্যাটার্ন হলো গ্রাফিক্যাল মডেল, যা মূল্য ওঠানামার ভিত্তিতে চার্টে তৈরি হয়। টেকনিক্যাল বিশ্লেষণের নীতি অনুযায়ী, ইতিহাসের (প্রাইস মুভমেন্ট) পুনরাবৃত্তি ঘটে। অর্থাৎ, পরিস্থিতি যদি একই রকম থাকে তাহলে প্রাইস মুভমেন্টও প্রায় একই রকম হয়। এর ফলে মূল্যের ওঠানামা কেমন হবে তা আগেই থেকেই অনুমান করা যায়।
ইন্সটাফরেক্স এর প্রাসঙ্গিক প্যাটার্নসমূহ সহজেই ব্যবহার করা যায়, যার মাধ্যমে মার্কেটের সর্বশেষ পরিস্থিতি জানা যায় এবং তার উপর ভিত্তি করে সিদ্ধান্ত নেওয়া যায়। আমাদের সেবাগুলো থেকে আপনি যেকোনো পেয়ার এবং টাইমফ্রেমের জন্য সর্বশেষ এবং সবচেয়ে প্রাসঙ্গিক প্যাটার্নগুলো খুঁজে পাবেন।
Triple Top
was formed on 14.04 at 12:50:18 (UTC+0)
signal strength 1 of 5
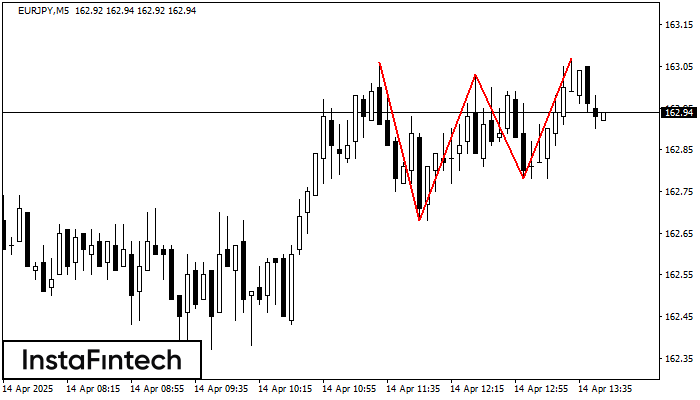
The Triple Top pattern has formed on the chart of the EURJPY M5. Features of the pattern: borders have an ascending angle; the lower line of the pattern has the coordinates 162.68/162.78 with the upper limit 163.06/163.07; the projection of the width is 38 points. The formation of the Triple Top figure most likely indicates a change in the trend from upward to downward. This means that in the event of a breakdown of the support level of 162.68, the price is most likely to continue the downward movement.
The M5 and M15 time frames may have more false entry points.
- All
- All
- Bearish Rectangle
- Bearish Symmetrical Triangle
- Bearish Symmetrical Triangle
- Bullish Rectangle
- Double Top
- Double Top
- Triple Bottom
- Triple Bottom
- Triple Top
- Triple Top
- All
- All
- Buy
- Sale
- All
- 1
- 2
- 3
- 4
- 5
Двойное дно
сформирован 31.05 в 13:20:01 (UTC+0)
сила сигнала 1 из 5

Сформирована фигура «Двойное дно» на графике #Bitcoin M5. Характеристика: Уровень поддержки 103250.25; Уровень сопротивления 103385.09; Ширина фигуры 13484 пунктов. В случае пробоя уровня сопротивления можно будет прогнозировать изменение тенденции
Таймфреймы М5 и М15 могут иметь больше ложных точек входа.
Открыть график инструмента в новом окне
Тройная вершина
сформирован 30.05 в 22:20:23 (UTC+0)
сила сигнала 1 из 5

По GOLD на M5 сформировалась фигура «Тройная вершина». Характеристика: Границы имеют восходящий угол. Нижняя граница фигуры имеет координаты 3289.23/3291.16, при этом верхняя граница 3295.36/3295.32. Проекция ширины 613 пунктов. Формирование фигуры
Таймфреймы М5 и М15 могут иметь больше ложных точек входа.
Открыть график инструмента в новом окне
Перевернутая голова и плечи
сформирован 30.05 в 21:50:24 (UTC+0)
сила сигнала 1 из 5

По #AMZN на M5 сформировалась фигура «Перевернутая голова и плечи». Голова закреплена на 201.64, при этом средняя линия шеи расположена на 204.52/205.01. Формирование фигуры «Перевернутая голова и плечи» наиболее вероятным
Таймфреймы М5 и М15 могут иметь больше ложных точек входа.
Открыть график инструмента в новом окне


