

অ্যাকচুয়াল প্যাটার্নস

প্যাটার্ন হলো গ্রাফিক্যাল মডেল, যা মূল্য ওঠানামার ভিত্তিতে চার্টে তৈরি হয়। টেকনিক্যাল বিশ্লেষণের নীতি অনুযায়ী, ইতিহাসের (প্রাইস মুভমেন্ট) পুনরাবৃত্তি ঘটে। অর্থাৎ, পরিস্থিতি যদি একই রকম থাকে তাহলে প্রাইস মুভমেন্টও প্রায় একই রকম হয়। এর ফলে মূল্যের ওঠানামা কেমন হবে তা আগেই থেকেই অনুমান করা যায়।
ইন্সটাফরেক্স এর প্রাসঙ্গিক প্যাটার্নসমূহ সহজেই ব্যবহার করা যায়, যার মাধ্যমে মার্কেটের সর্বশেষ পরিস্থিতি জানা যায় এবং তার উপর ভিত্তি করে সিদ্ধান্ত নেওয়া যায়। আমাদের সেবাগুলো থেকে আপনি যেকোনো পেয়ার এবং টাইমফ্রেমের জন্য সর্বশেষ এবং সবচেয়ে প্রাসঙ্গিক প্যাটার্নগুলো খুঁজে পাবেন।
Bullish Symmetrical Triangle
was formed on 14.04 at 06:47:26 (UTC+0)
signal strength 2 of 5
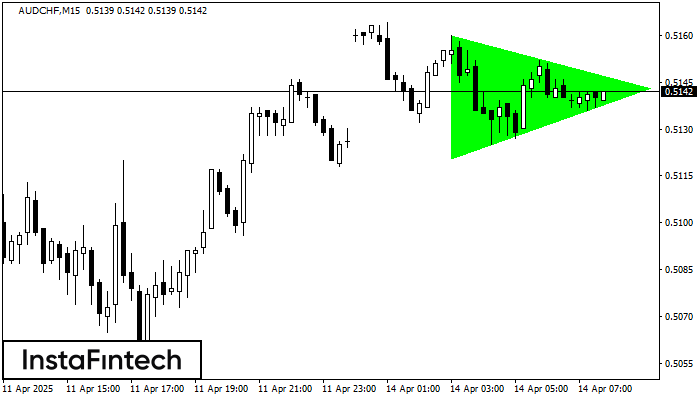
According to the chart of M15, AUDCHF formed the Bullish Symmetrical Triangle pattern, which signals the trend will continue. Description. The upper border of the pattern touches the coordinates 0.5160/0.5143 whereas the lower border goes across 0.5120/0.5143. The pattern width is measured on the chart at 40 pips. If the Bullish Symmetrical Triangle pattern is in progress during the upward trend, this indicates the current trend will go on. In case 0.5143 is broken, the price could continue its move toward 0.5166.
The M5 and M15 time frames may have more false entry points.
আরও দেখুন
- All
- All
- Bearish Rectangle
- Bearish Symmetrical Triangle
- Bearish Symmetrical Triangle
- Bullish Rectangle
- Double Top
- Double Top
- Triple Bottom
- Triple Bottom
- Triple Top
- Triple Top
- All
- All
- Buy
- Sale
- All
- 1
- 2
- 3
- 4
- 5
Head and Shoulders
was formed on 28.05 at 17:00:24 (UTC+0)
signal strength 1 of 5
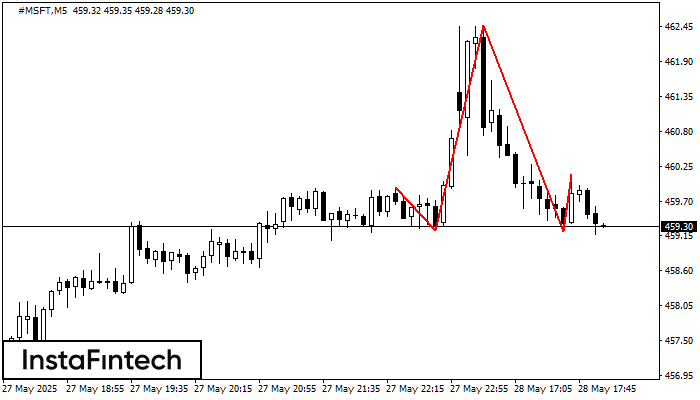
The #MSFT M5 formed the Head and Shoulders pattern with the following features: The Head’s top is at 462.46, the Neckline and the upward angle are at 459.23/459.22. The formation
The M5 and M15 time frames may have more false entry points.
Open chart in a new window
Triple Top
was formed on 28.05 at 16:45:20 (UTC+0)
signal strength 1 of 5
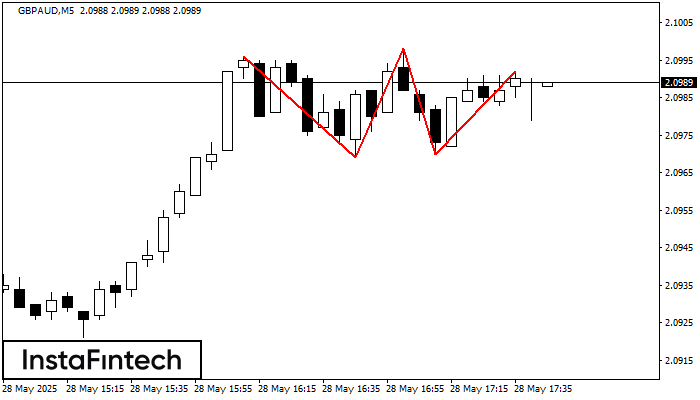
The Triple Top pattern has formed on the chart of the GBPAUD M5 trading instrument. It is a reversal pattern featuring the following characteristics: resistance level 4, support level -1
The M5 and M15 time frames may have more false entry points.
Open chart in a new window
Triple Top
was formed on 28.05 at 16:30:35 (UTC+0)
signal strength 3 of 5
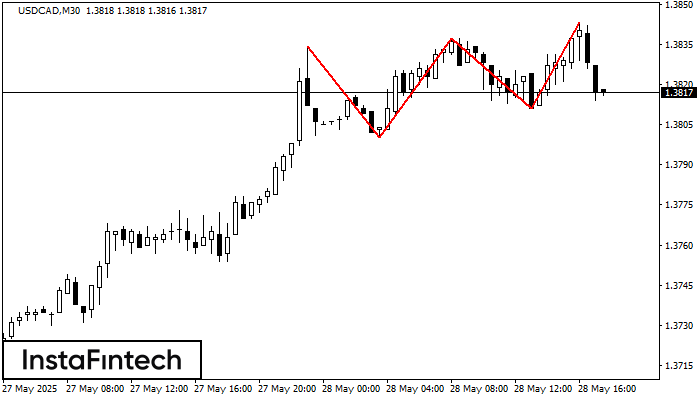
The Triple Top pattern has formed on the chart of the USDCAD M30. Features of the pattern: borders have an ascending angle; the lower line of the pattern
Open chart in a new window


