

অ্যাকচুয়াল প্যাটার্নস

প্যাটার্ন হলো গ্রাফিক্যাল মডেল, যা মূল্য ওঠানামার ভিত্তিতে চার্টে তৈরি হয়। টেকনিক্যাল বিশ্লেষণের নীতি অনুযায়ী, ইতিহাসের (প্রাইস মুভমেন্ট) পুনরাবৃত্তি ঘটে। অর্থাৎ, পরিস্থিতি যদি একই রকম থাকে তাহলে প্রাইস মুভমেন্টও প্রায় একই রকম হয়। এর ফলে মূল্যের ওঠানামা কেমন হবে তা আগেই থেকেই অনুমান করা যায়।
ইন্সটাফরেক্স এর প্রাসঙ্গিক প্যাটার্নসমূহ সহজেই ব্যবহার করা যায়, যার মাধ্যমে মার্কেটের সর্বশেষ পরিস্থিতি জানা যায় এবং তার উপর ভিত্তি করে সিদ্ধান্ত নেওয়া যায়। আমাদের সেবাগুলো থেকে আপনি যেকোনো পেয়ার এবং টাইমফ্রেমের জন্য সর্বশেষ এবং সবচেয়ে প্রাসঙ্গিক প্যাটার্নগুলো খুঁজে পাবেন।
Triple Bottom
was formed on 14.04 at 01:00:54 (UTC+0)
signal strength 4 of 5

The Triple Bottom pattern has been formed on USDCHF H1. It has the following characteristics: resistance level 0.8256/0.8192; support level 0.8140/0.8142; the width is 116 points. In the event of a breakdown of the resistance level of 0.8256, the price is likely to continue an upward movement at least to 0.8138.
আরও দেখুন
- All
- All
- Bearish Rectangle
- Bearish Symmetrical Triangle
- Bearish Symmetrical Triangle
- Bullish Rectangle
- Double Top
- Double Top
- Triple Bottom
- Triple Bottom
- Triple Top
- Triple Top
- All
- All
- Buy
- Sale
- All
- 1
- 2
- 3
- 4
- 5
Bullish Symmetrical Triangle
was formed on 22.08 at 09:45:52 (UTC+0)
signal strength 1 of 5
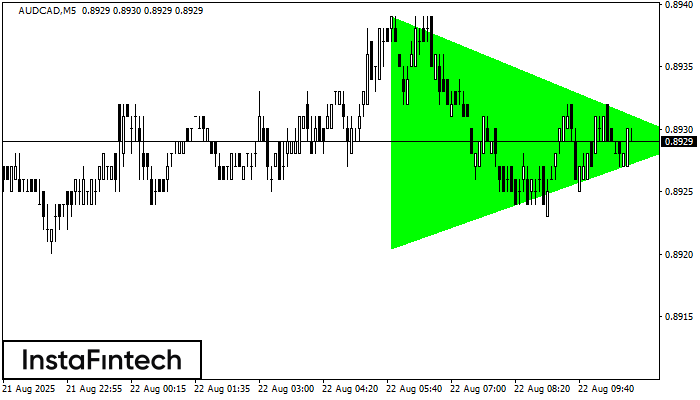
According to the chart of M5, AUDCAD formed the Bullish Symmetrical Triangle pattern. The lower border of the pattern touches the coordinates 0.8920/0.8929 whereas the upper border goes across 0.8939/0.8929
The M5 and M15 time frames may have more false entry points.
Open chart in a new window
Double Top
was formed on 22.08 at 07:30:33 (UTC+0)
signal strength 3 of 5
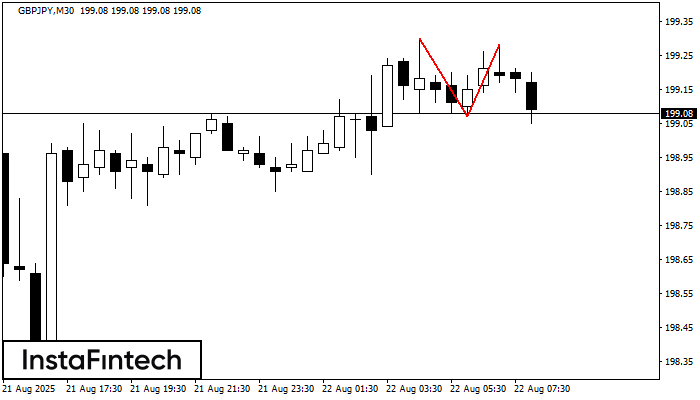
The Double Top reversal pattern has been formed on GBPJPY M30. Characteristics: the upper boundary 199.30; the lower boundary 199.07; the width of the pattern is 21 points. Sell trades
Open chart in a new window
Bearish Rectangle
was formed on 22.08 at 06:30:53 (UTC+0)
signal strength 4 of 5
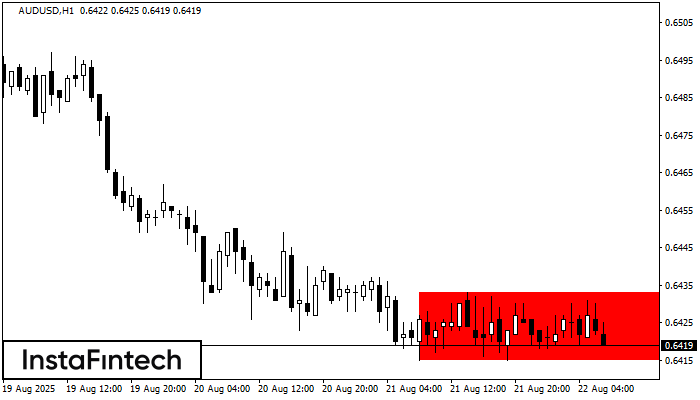
According to the chart of H1, AUDUSD formed the Bearish Rectangle. The pattern indicates a trend continuation. The upper border is 0.6433, the lower border is 0.6415. The signal means
Open chart in a new window


