

অ্যাকচুয়াল প্যাটার্নস

প্যাটার্ন হলো গ্রাফিক্যাল মডেল, যা মূল্য ওঠানামার ভিত্তিতে চার্টে তৈরি হয়। টেকনিক্যাল বিশ্লেষণের নীতি অনুযায়ী, ইতিহাসের (প্রাইস মুভমেন্ট) পুনরাবৃত্তি ঘটে। অর্থাৎ, পরিস্থিতি যদি একই রকম থাকে তাহলে প্রাইস মুভমেন্টও প্রায় একই রকম হয়। এর ফলে মূল্যের ওঠানামা কেমন হবে তা আগেই থেকেই অনুমান করা যায়।
ইন্সটাফরেক্স এর প্রাসঙ্গিক প্যাটার্নসমূহ সহজেই ব্যবহার করা যায়, যার মাধ্যমে মার্কেটের সর্বশেষ পরিস্থিতি জানা যায় এবং তার উপর ভিত্তি করে সিদ্ধান্ত নেওয়া যায়। আমাদের সেবাগুলো থেকে আপনি যেকোনো পেয়ার এবং টাইমফ্রেমের জন্য সর্বশেষ এবং সবচেয়ে প্রাসঙ্গিক প্যাটার্নগুলো খুঁজে পাবেন।
Inverse Head and Shoulder
was formed on 11.04 at 15:59:57 (UTC+0)
signal strength 3 of 5

According to the chart of M30, AUDCHF produced the pattern termed the Inverse Head and Shoulder. The Head is fixed at 0.5043 while the median line of the Neck is set at 0.5120/0.5113. The formation of the Inverse Head and Shoulder Pattern clearly indicates a reversal of the downward trend. In means that in case the scenario comes true, the price of AUDCHF will go towards 0.5143.
- All
- All
- Bearish Rectangle
- Bearish Symmetrical Triangle
- Bearish Symmetrical Triangle
- Bullish Rectangle
- Double Top
- Double Top
- Triple Bottom
- Triple Bottom
- Triple Top
- Triple Top
- All
- All
- Buy
- Sale
- All
- 1
- 2
- 3
- 4
- 5
ডাবল টপ
was formed on 02.06 at 03:20:17 (UTC+0)
signal strength 1 of 5
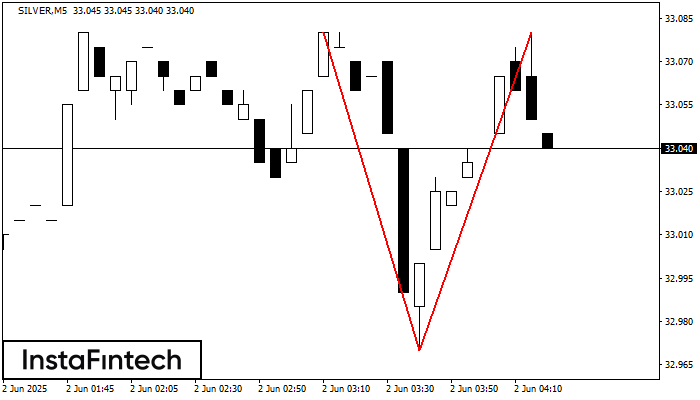
M5 চার্টে, SILVER-এর ডাবল টপ প্যাটার্নটি গঠিত হয়েছে। এটি এই ইঙ্গিত দেয় যে চলমান প্রবণতা ঊর্ধ্বমুখী থেকে নিম্নমুখীতে পরিবর্তিত হয়েছে। সম্ভবত, যদি 32.97 প্যাটার্নের ভিত্তিটি ব্রেক করা হয়, তাহলে নিম্নমুখী
M5 এবং M15 টাইম ফ্রেমে আরও ভুল এন্ট্রি পয়েন্ট থাকতে পারে।
Open chart in a new window
বুলিশ পেন্যান্ট
was formed on 02.06 at 02:15:09 (UTC+0)
signal strength 2 of 5
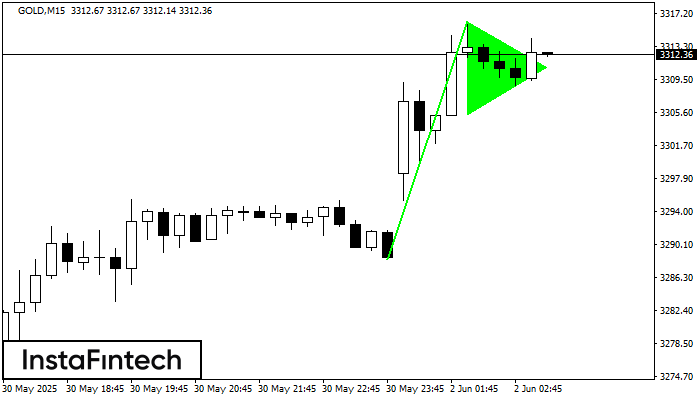
M15 চার্টে, GOLD-এ বুলিশ পেন্যান্ট প্যাটার্নটি গঠিত হয়েছে। এটি এক ধরনের ধারাবাহিকতার প্যাটার্ন। অনুমিতভাবে, যদি মূল্য পেন্যান্টের সর্বোচ্চ 3316.23 -এর উপরে স্থির হয়, তাহলে আরও ঊর্ধ্বমুখী প্রবণতার সম্ভবনা রয়েছে।
M5 এবং M15 টাইম ফ্রেমে আরও ভুল এন্ট্রি পয়েন্ট থাকতে পারে।
Open chart in a new window
ডাবল টপ
was formed on 02.06 at 02:00:45 (UTC+0)
signal strength 2 of 5
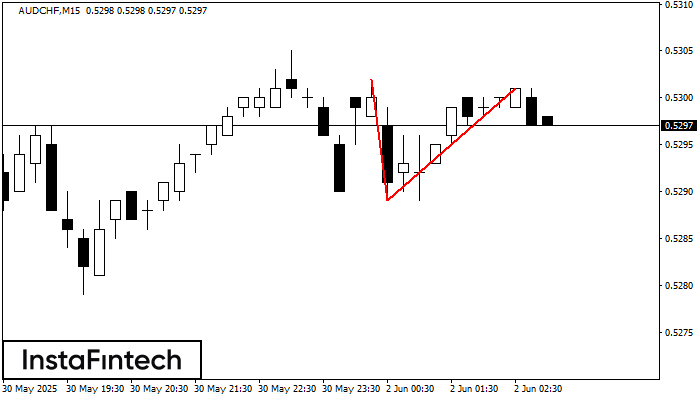
M15 চার্টে, AUDCHF-এর ডাবল টপ রিভার্সাল বা বিপরীতমুখী প্যাটার্ন গঠিত হয়েছে। বৈশিষ্ট্য: উপরের সীমানা 0.5301; নীচের সীমানা 0.5289; প্যাটার্নের প্রস্থ 12 পয়েন্ট। সংকেত: নীচের সীমানা ব্রেক করা হলে 0.5267 স্তরের
M5 এবং M15 টাইম ফ্রেমে আরও ভুল এন্ট্রি পয়েন্ট থাকতে পারে।
Open chart in a new window


