

অ্যাকচুয়াল প্যাটার্নস

প্যাটার্ন হলো গ্রাফিক্যাল মডেল, যা মূল্য ওঠানামার ভিত্তিতে চার্টে তৈরি হয়। টেকনিক্যাল বিশ্লেষণের নীতি অনুযায়ী, ইতিহাসের (প্রাইস মুভমেন্ট) পুনরাবৃত্তি ঘটে। অর্থাৎ, পরিস্থিতি যদি একই রকম থাকে তাহলে প্রাইস মুভমেন্টও প্রায় একই রকম হয়। এর ফলে মূল্যের ওঠানামা কেমন হবে তা আগেই থেকেই অনুমান করা যায়।
ইন্সটাফরেক্স এর প্রাসঙ্গিক প্যাটার্নসমূহ সহজেই ব্যবহার করা যায়, যার মাধ্যমে মার্কেটের সর্বশেষ পরিস্থিতি জানা যায় এবং তার উপর ভিত্তি করে সিদ্ধান্ত নেওয়া যায়। আমাদের সেবাগুলো থেকে আপনি যেকোনো পেয়ার এবং টাইমফ্রেমের জন্য সর্বশেষ এবং সবচেয়ে প্রাসঙ্গিক প্যাটার্নগুলো খুঁজে পাবেন।
Bullish Symmetrical Triangle
was formed on 09.04 at 11:56:23 (UTC+0)
signal strength 1 of 5
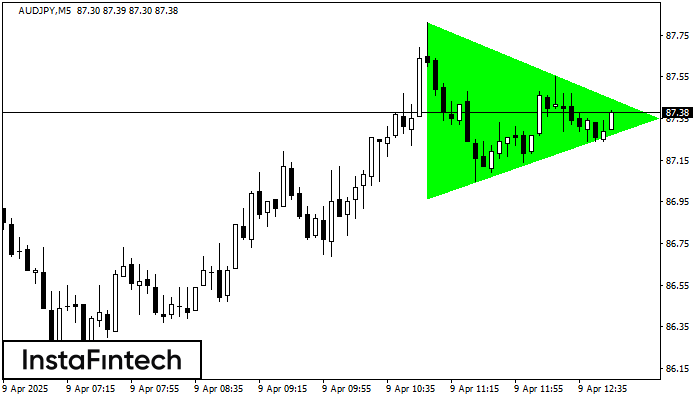
According to the chart of M5, AUDJPY formed the Bullish Symmetrical Triangle pattern, which signals the trend will continue. Description. The upper border of the pattern touches the coordinates 87.81/87.35 whereas the lower border goes across 86.97/87.35. The pattern width is measured on the chart at 84 pips. If the Bullish Symmetrical Triangle pattern is in progress during the upward trend, this indicates the current trend will go on. In case 87.35 is broken, the price could continue its move toward 87.50.
The M5 and M15 time frames may have more false entry points.
- All
- All
- Bearish Rectangle
- Bearish Symmetrical Triangle
- Bearish Symmetrical Triangle
- Bullish Rectangle
- Double Top
- Double Top
- Triple Bottom
- Triple Bottom
- Triple Top
- Triple Top
- All
- All
- Buy
- Sale
- All
- 1
- 2
- 3
- 4
- 5
ডাবল টপ
was formed on 23.05 at 21:55:30 (UTC+0)
signal strength 1 of 5
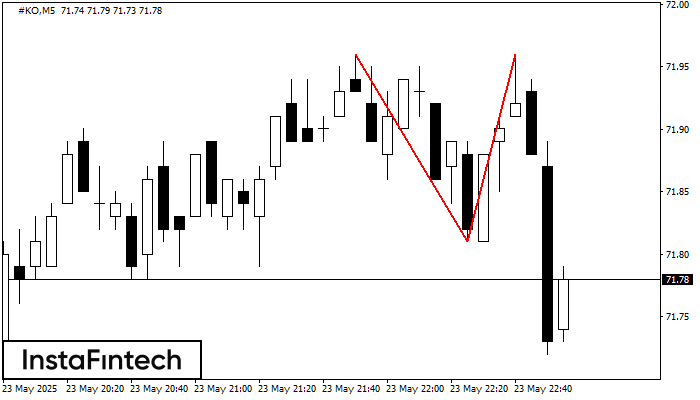
M5 চার্টে, #KO-এর ডাবল টপ রিভার্সাল বা বিপরীতমুখী প্যাটার্ন গঠিত হয়েছে। বৈশিষ্ট্য: উপরের সীমানা 71.96; নীচের সীমানা 71.81; প্যাটার্নের প্রস্থ 15 পয়েন্ট। সংকেত: নীচের সীমানা ব্রেক করা হলে 71.66 স্তরের
M5 এবং M15 টাইম ফ্রেমে আরও ভুল এন্ট্রি পয়েন্ট থাকতে পারে।
Open chart in a new window
ট্রিপল বটম
was formed on 23.05 at 21:55:17 (UTC+0)
signal strength 1 of 5
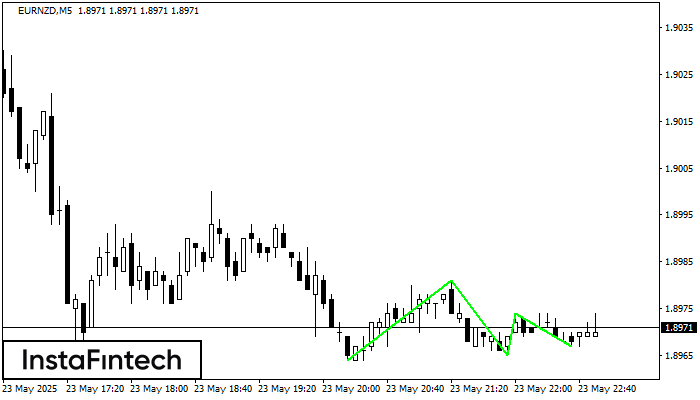
M5 চার্টে, EURNZD ট্রেডিং ইন্সট্রুমেন্টের ট্রিপল বটম প্যাটার্ন গঠিত হয়েছে। 1.8981/1.8974 ব্রেকডাউনের ক্ষেত্রে এই প্যাটার্ন নিম্নমুখী প্রবণতা থেকে ঊর্ধ্বমুখী প্রবণতায় পরিবর্তনের সংকেত দেয়৷
M5 এবং M15 টাইম ফ্রেমে আরও ভুল এন্ট্রি পয়েন্ট থাকতে পারে।
Open chart in a new window
বুলিশ রেক্ট্যাঙ্গেল
was formed on 23.05 at 21:41:57 (UTC+0)
signal strength 1 of 5
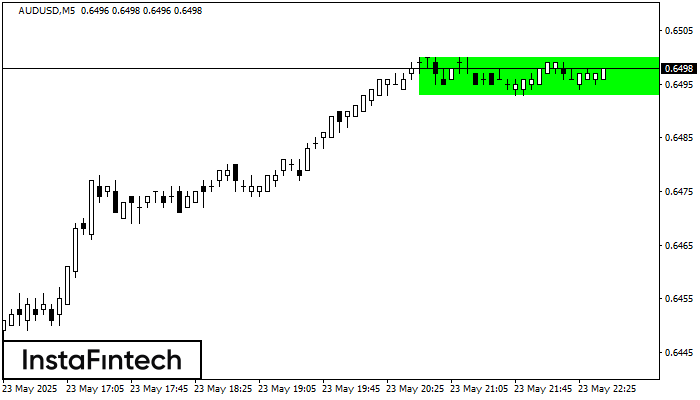
M5 চার্ট অনুযায়ী, AUDUSD বুলিশ রেক্ট্যাঙ্গেল গঠন করেছে। এই প্যাটার্ন চলমান প্রবণতার ধারাবাহিকতা নির্দেশ করে। উপরের সীমানা হল 0.6500, নীচের সীমানা হল 0.6493৷ এই সংকেতের অর্থ হল বুলিশ রেক্ট্যাঙ্গেল -এর
M5 এবং M15 টাইম ফ্রেমে আরও ভুল এন্ট্রি পয়েন্ট থাকতে পারে।
Open chart in a new window


