

অ্যাকচুয়াল প্যাটার্নস

প্যাটার্ন হলো গ্রাফিক্যাল মডেল, যা মূল্য ওঠানামার ভিত্তিতে চার্টে তৈরি হয়। টেকনিক্যাল বিশ্লেষণের নীতি অনুযায়ী, ইতিহাসের (প্রাইস মুভমেন্ট) পুনরাবৃত্তি ঘটে। অর্থাৎ, পরিস্থিতি যদি একই রকম থাকে তাহলে প্রাইস মুভমেন্টও প্রায় একই রকম হয়। এর ফলে মূল্যের ওঠানামা কেমন হবে তা আগেই থেকেই অনুমান করা যায়।
ইন্সটাফরেক্স এর প্রাসঙ্গিক প্যাটার্নসমূহ সহজেই ব্যবহার করা যায়, যার মাধ্যমে মার্কেটের সর্বশেষ পরিস্থিতি জানা যায় এবং তার উপর ভিত্তি করে সিদ্ধান্ত নেওয়া যায়। আমাদের সেবাগুলো থেকে আপনি যেকোনো পেয়ার এবং টাইমফ্রেমের জন্য সর্বশেষ এবং সবচেয়ে প্রাসঙ্গিক প্যাটার্নগুলো খুঁজে পাবেন।
Double Top
was formed on 08.04 at 17:30:23 (UTC+0)
signal strength 2 of 5
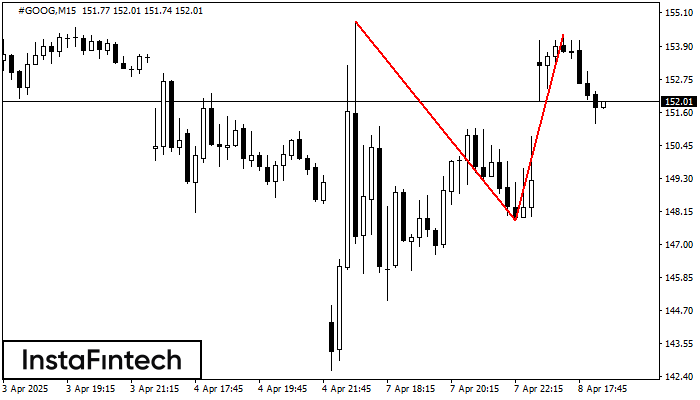
The Double Top pattern has been formed on #GOOG M15. It signals that the trend has been changed from upwards to downwards. Probably, if the base of the pattern 147.83 is broken, the downward movement will continue.
The M5 and M15 time frames may have more false entry points.
- All
- All
- Bearish Rectangle
- Bearish Symmetrical Triangle
- Bearish Symmetrical Triangle
- Bullish Rectangle
- Double Top
- Double Top
- Triple Bottom
- Triple Bottom
- Triple Top
- Triple Top
- All
- All
- Buy
- Sale
- All
- 1
- 2
- 3
- 4
- 5
Double Bottom
was formed on 30.05 at 08:30:30 (UTC+0)
signal strength 3 of 5
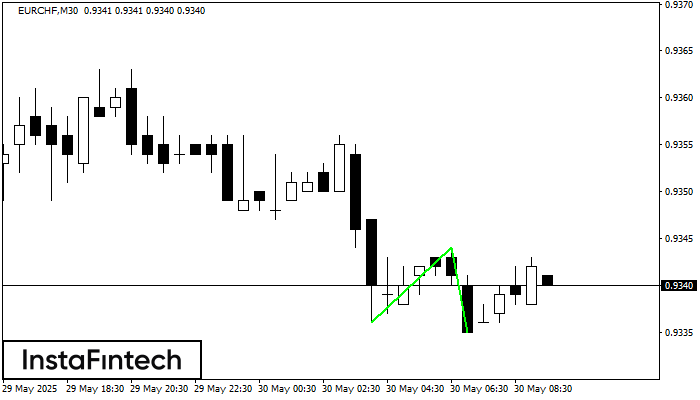
The Double Bottom pattern has been formed on EURCHF M30. This formation signals a reversal of the trend from downwards to upwards. The signal is that a buy trade should
Open chart in a new window
Inverse Head and Shoulder
was formed on 30.05 at 08:00:23 (UTC+0)
signal strength 3 of 5
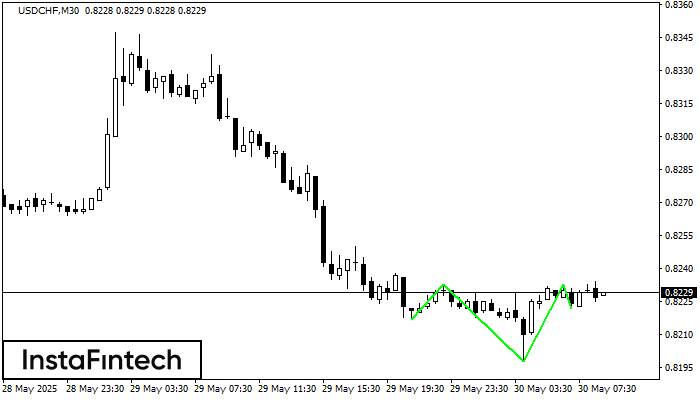
According to M30, USDCHF is shaping the technical pattern – the Inverse Head and Shoulder. In case the Neckline 0.8233/0.8233 is broken out, the instrument is likely to move toward
Open chart in a new window
Double Bottom
was formed on 30.05 at 07:55:32 (UTC+0)
signal strength 1 of 5
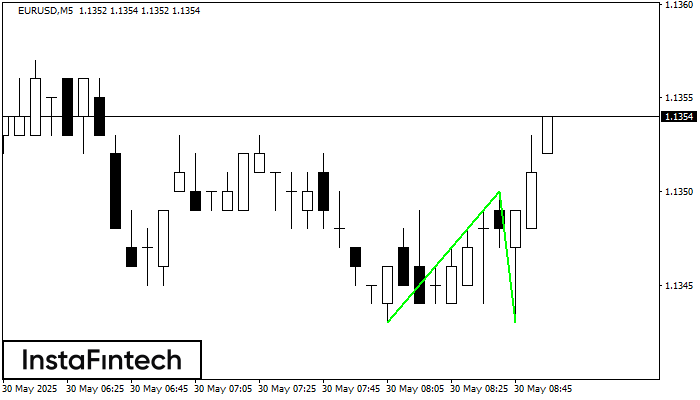
The Double Bottom pattern has been formed on EURUSD M5. Characteristics: the support level 1.1343; the resistance level 1.1350; the width of the pattern 7 points. If the resistance level
The M5 and M15 time frames may have more false entry points.
Open chart in a new window


