

অ্যাকচুয়াল প্যাটার্নস

প্যাটার্ন হলো গ্রাফিক্যাল মডেল, যা মূল্য ওঠানামার ভিত্তিতে চার্টে তৈরি হয়। টেকনিক্যাল বিশ্লেষণের নীতি অনুযায়ী, ইতিহাসের (প্রাইস মুভমেন্ট) পুনরাবৃত্তি ঘটে। অর্থাৎ, পরিস্থিতি যদি একই রকম থাকে তাহলে প্রাইস মুভমেন্টও প্রায় একই রকম হয়। এর ফলে মূল্যের ওঠানামা কেমন হবে তা আগেই থেকেই অনুমান করা যায়।
ইন্সটাফরেক্স এর প্রাসঙ্গিক প্যাটার্নসমূহ সহজেই ব্যবহার করা যায়, যার মাধ্যমে মার্কেটের সর্বশেষ পরিস্থিতি জানা যায় এবং তার উপর ভিত্তি করে সিদ্ধান্ত নেওয়া যায়। আমাদের সেবাগুলো থেকে আপনি যেকোনো পেয়ার এবং টাইমফ্রেমের জন্য সর্বশেষ এবং সবচেয়ে প্রাসঙ্গিক প্যাটার্নগুলো খুঁজে পাবেন।
Bearish Symmetrical Triangle
was formed on 07.04 at 13:37:39 (UTC+0)
signal strength 2 of 5
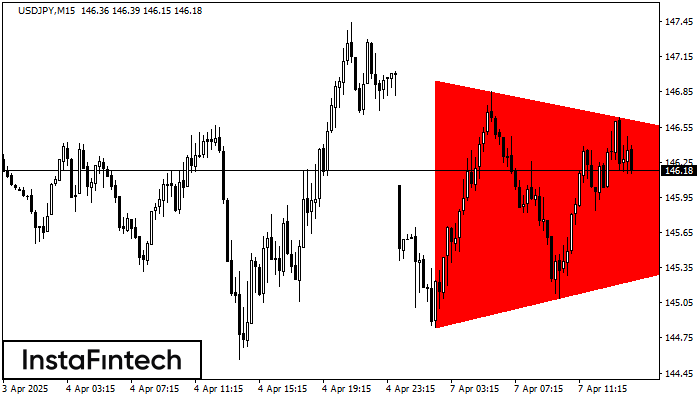
According to the chart of M15, USDJPY formed the Bearish Symmetrical Triangle pattern. Description: The lower border is 144.84/145.98 and upper border is 146.95/145.98. The pattern width is measured on the chart at -211 pips. The formation of the Bearish Symmetrical Triangle pattern evidently signals a continuation of the downward trend. In other words, if the scenario comes true and USDJPY breaches the lower border, the price could continue its move toward 145.76.
The M5 and M15 time frames may have more false entry points.
আরও দেখুন
- All
- All
- Bearish Rectangle
- Bearish Symmetrical Triangle
- Bearish Symmetrical Triangle
- Bullish Rectangle
- Double Top
- Double Top
- Triple Bottom
- Triple Bottom
- Triple Top
- Triple Top
- All
- All
- Buy
- Sale
- All
- 1
- 2
- 3
- 4
- 5
Teratas Ganda
was formed on 05.09 at 05:05:31 (UTC+0)
signal strength 1 of 5
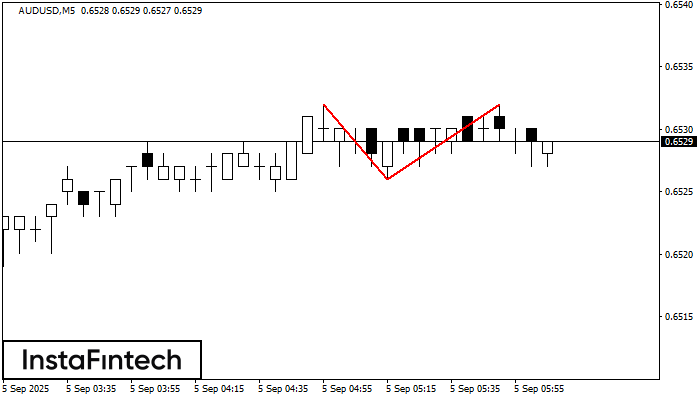
Pola reversal Teratas Ganda telah terbentuk pada AUDUSD M5. Karakteristik: batas atas 0.6532; batas bawah 0.6526; lebar pola 6 poin. Transaksi jual lebih baik dibuka di bawah batas bawah 0.6526
Rangka waktu M5 dan M15 mungkin memiliki lebih dari titik entri yang keliru.
Open chart in a new window
Bawah Ganda
was formed on 05.09 at 04:35:43 (UTC+0)
signal strength 1 of 5
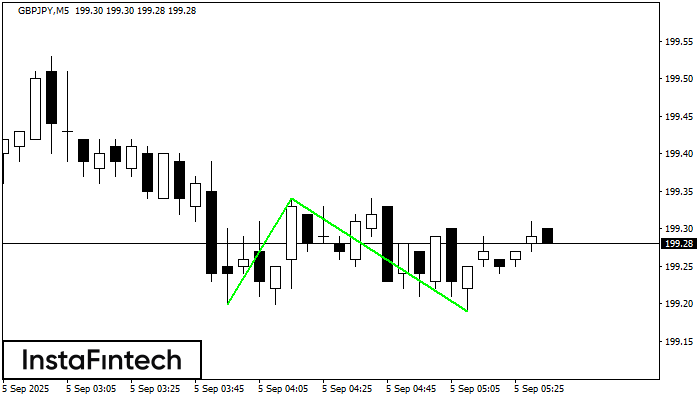
Pola Bawah Ganda telah terbentuk pada GBPJPY M5; batas atas di 199.34; batas bawah di 199.19. Lebar pola sebesar 14 poin. Jika harga menembus batas atas 199.34, Perubahan dalam tren
Rangka waktu M5 dan M15 mungkin memiliki lebih dari titik entri yang keliru.
Open chart in a new window
Bawah Ganda
was formed on 05.09 at 00:00:32 (UTC+0)
signal strength 3 of 5
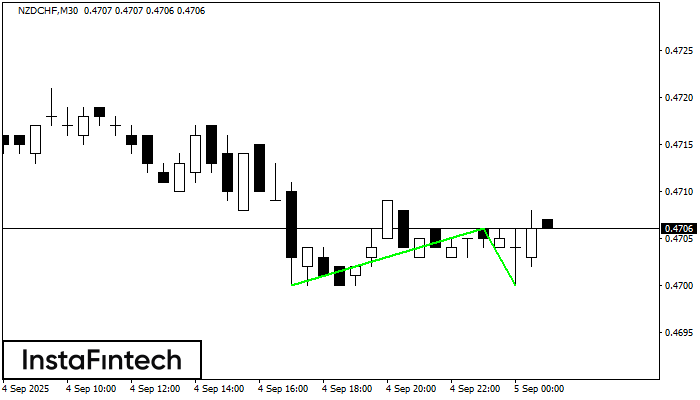
Pola Bawah Ganda telah terbentuk pada NZDCHF M30; batas atas di 0.4706; batas bawah di 0.4700. Lebar pola sebesar 6 poin. Jika harga menembus batas atas 0.4706, Perubahan dalam tren
Open chart in a new window


