

অ্যাকচুয়াল প্যাটার্নস

প্যাটার্ন হলো গ্রাফিক্যাল মডেল, যা মূল্য ওঠানামার ভিত্তিতে চার্টে তৈরি হয়। টেকনিক্যাল বিশ্লেষণের নীতি অনুযায়ী, ইতিহাসের (প্রাইস মুভমেন্ট) পুনরাবৃত্তি ঘটে। অর্থাৎ, পরিস্থিতি যদি একই রকম থাকে তাহলে প্রাইস মুভমেন্টও প্রায় একই রকম হয়। এর ফলে মূল্যের ওঠানামা কেমন হবে তা আগেই থেকেই অনুমান করা যায়।
ইন্সটাফরেক্স এর প্রাসঙ্গিক প্যাটার্নসমূহ সহজেই ব্যবহার করা যায়, যার মাধ্যমে মার্কেটের সর্বশেষ পরিস্থিতি জানা যায় এবং তার উপর ভিত্তি করে সিদ্ধান্ত নেওয়া যায়। আমাদের সেবাগুলো থেকে আপনি যেকোনো পেয়ার এবং টাইমফ্রেমের জন্য সর্বশেষ এবং সবচেয়ে প্রাসঙ্গিক প্যাটার্নগুলো খুঁজে পাবেন।
Bullish Symmetrical Triangle
was formed on 07.04 at 06:30:04 (UTC+0)
signal strength 3 of 5

According to the chart of M30, EURCAD formed the Bullish Symmetrical Triangle pattern. The lower border of the pattern touches the coordinates 1.5415/1.5608 whereas the upper border goes across 1.5743/1.5608. If the Bullish Symmetrical Triangle pattern is in progress, this evidently signals a further upward trend. In other words, in case the scenario comes true, the price of EURCAD will breach the upper border to head for 1.5638.
- All
- All
- Bearish Rectangle
- Bearish Symmetrical Triangle
- Bearish Symmetrical Triangle
- Bullish Rectangle
- Double Top
- Double Top
- Triple Bottom
- Triple Bottom
- Triple Top
- Triple Top
- All
- All
- Buy
- Sale
- All
- 1
- 2
- 3
- 4
- 5
বিয়ারিশ ফ্ল্যাগ
was formed on 29.05 at 20:13:23 (UTC+0)
signal strength 1 of 5
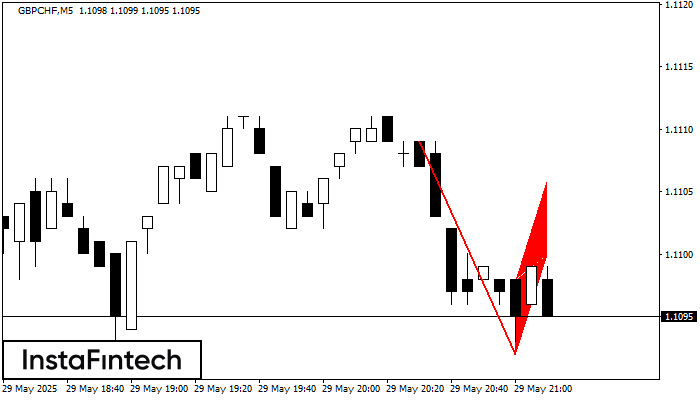
M5 চার্টে GBPCHF-এর বিয়ারিশ ফ্ল্যাগ প্যাটার্ন গঠিত হয়েছে। অতএব, নিকটতম মেয়াদে নিম্নমুখী প্রবণতা অব্যাহত থাকার সম্ভাবনা রয়েছে। যখনই মূল্য 1.1092-এর সর্বনিম্ন স্তরের নীচে ব্রেক করবে, ট্রেডারদের বাজারে প্রবেশ করা উচিত।
M5 এবং M15 টাইম ফ্রেমে আরও ভুল এন্ট্রি পয়েন্ট থাকতে পারে।
Open chart in a new window
ডাবল টপ
was formed on 29.05 at 20:11:22 (UTC+0)
signal strength 1 of 5
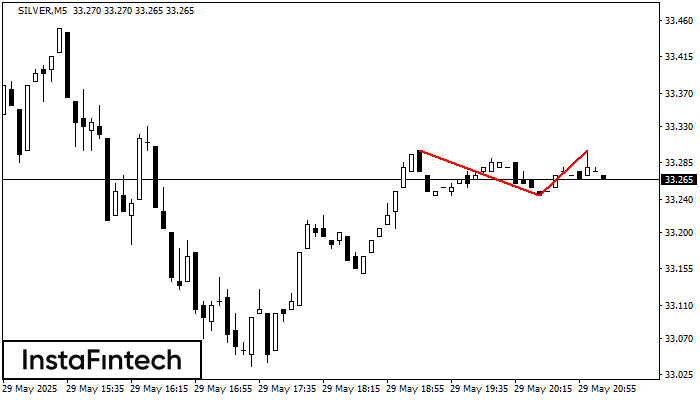
M5 চার্টে, SILVER-এর ডাবল টপ রিভার্সাল বা বিপরীতমুখী প্যাটার্ন গঠিত হয়েছে। বৈশিষ্ট্য: উপরের সীমানা 33.30; নীচের সীমানা 33.24; প্যাটার্নের প্রস্থ হল 55 পয়েন্ট। 33.24 33.23 স্তরের দিকে সম্ভাব্য মুভমেন্টের সাথে
M5 এবং M15 টাইম ফ্রেমে আরও ভুল এন্ট্রি পয়েন্ট থাকতে পারে।
Open chart in a new window
ডাবল বটম
was formed on 29.05 at 20:10:48 (UTC+0)
signal strength 1 of 5
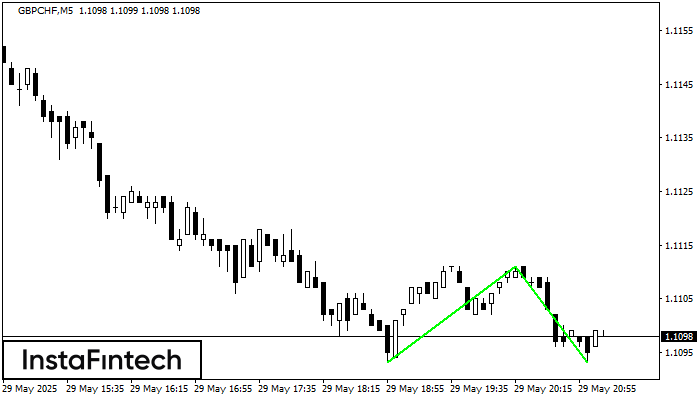
M5 চার্টে, GBPCHF-এর ডাবল বটম প্যাটার্নটি গঠিত হয়েছে। উপরের সীমানা হল 1.1111; নীচের সীমানা হল 1.1093। প্যাটার্নের প্রস্থ হল 18 পয়েন্ট। 1.1111-এর উপরের সীমানা ভেদ করার ক্ষেত্রে, প্রবণতা পরিবর্তনের পূর্বাভাস
M5 এবং M15 টাইম ফ্রেমে আরও ভুল এন্ট্রি পয়েন্ট থাকতে পারে।
Open chart in a new window


