

অ্যাকচুয়াল প্যাটার্নস

প্যাটার্ন হলো গ্রাফিক্যাল মডেল, যা মূল্য ওঠানামার ভিত্তিতে চার্টে তৈরি হয়। টেকনিক্যাল বিশ্লেষণের নীতি অনুযায়ী, ইতিহাসের (প্রাইস মুভমেন্ট) পুনরাবৃত্তি ঘটে। অর্থাৎ, পরিস্থিতি যদি একই রকম থাকে তাহলে প্রাইস মুভমেন্টও প্রায় একই রকম হয়। এর ফলে মূল্যের ওঠানামা কেমন হবে তা আগেই থেকেই অনুমান করা যায়।
ইন্সটাফরেক্স এর প্রাসঙ্গিক প্যাটার্নসমূহ সহজেই ব্যবহার করা যায়, যার মাধ্যমে মার্কেটের সর্বশেষ পরিস্থিতি জানা যায় এবং তার উপর ভিত্তি করে সিদ্ধান্ত নেওয়া যায়। আমাদের সেবাগুলো থেকে আপনি যেকোনো পেয়ার এবং টাইমফ্রেমের জন্য সর্বশেষ এবং সবচেয়ে প্রাসঙ্গিক প্যাটার্নগুলো খুঁজে পাবেন।
Bearish pennant
was formed on 07.04 at 01:30:15 (UTC+0)
signal strength 3 of 5
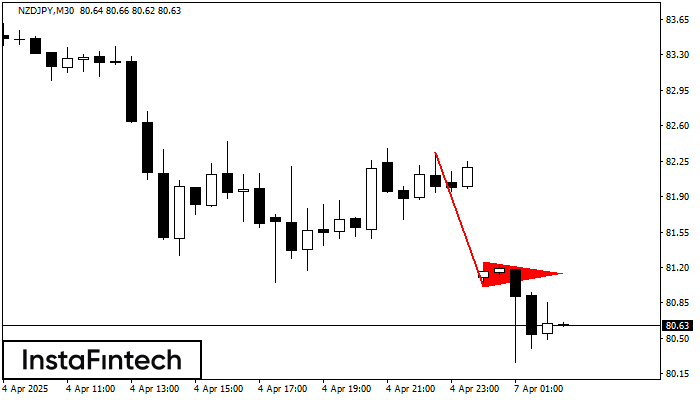
The Bearish pennant pattern has formed on the NZDJPY M30 chart. This pattern type is characterized by a slight slowdown after which the price will move in the direction of the original trend. In case the price fixes below the pattern’s low of 81.01, a trader will be able to successfully enter the sell position.
- All
- All
- Bearish Rectangle
- Bearish Symmetrical Triangle
- Bearish Symmetrical Triangle
- Bullish Rectangle
- Double Top
- Double Top
- Triple Bottom
- Triple Bottom
- Triple Top
- Triple Top
- All
- All
- Buy
- Sale
- All
- 1
- 2
- 3
- 4
- 5
Bullish Rectangle
сформирован 15.04 в 22:01:27 (UTC+0)
сила сигнала 3 из 5

According to the chart of M30, NZDCHF formed the Bullish Rectangle. This type of a pattern indicates a trend continuation. It consists of two levels: resistance 0.4859 and support 0.4839
Открыть график инструмента в новом окне
Bearish Rectangle
сформирован 15.04 в 12:08:27 (UTC+0)
сила сигнала 3 из 5
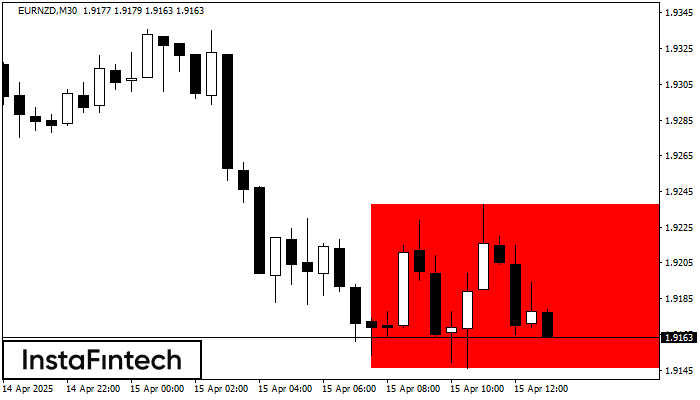
According to the chart of M30, EURNZD formed the Bearish Rectangle which is a pattern of a trend continuation. The pattern is contained within the following borders: lower border 1.9146
Открыть график инструмента в новом окне
Bullish Rectangle
сформирован 14.04 в 19:23:06 (UTC+0)
сила сигнала 3 из 5
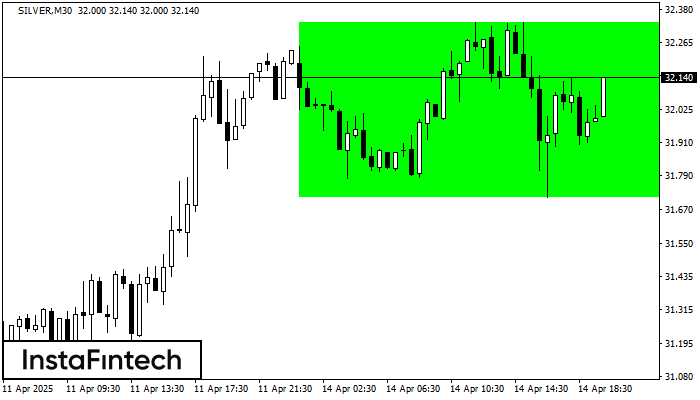
According to the chart of M30, SILVER formed the Bullish Rectangle. The pattern indicates a trend continuation. The upper border is 32.34, the lower border is 31.71. The signal means
Открыть график инструмента в новом окне


