

অ্যাকচুয়াল প্যাটার্নস

প্যাটার্ন হলো গ্রাফিক্যাল মডেল, যা মূল্য ওঠানামার ভিত্তিতে চার্টে তৈরি হয়। টেকনিক্যাল বিশ্লেষণের নীতি অনুযায়ী, ইতিহাসের (প্রাইস মুভমেন্ট) পুনরাবৃত্তি ঘটে। অর্থাৎ, পরিস্থিতি যদি একই রকম থাকে তাহলে প্রাইস মুভমেন্টও প্রায় একই রকম হয়। এর ফলে মূল্যের ওঠানামা কেমন হবে তা আগেই থেকেই অনুমান করা যায়।
ইন্সটাফরেক্স এর প্রাসঙ্গিক প্যাটার্নসমূহ সহজেই ব্যবহার করা যায়, যার মাধ্যমে মার্কেটের সর্বশেষ পরিস্থিতি জানা যায় এবং তার উপর ভিত্তি করে সিদ্ধান্ত নেওয়া যায়। আমাদের সেবাগুলো থেকে আপনি যেকোনো পেয়ার এবং টাইমফ্রেমের জন্য সর্বশেষ এবং সবচেয়ে প্রাসঙ্গিক প্যাটার্নগুলো খুঁজে পাবেন।
Bearish Symmetrical Triangle
was formed on 04.04 at 20:15:52 (UTC+0)
signal strength 1 of 5
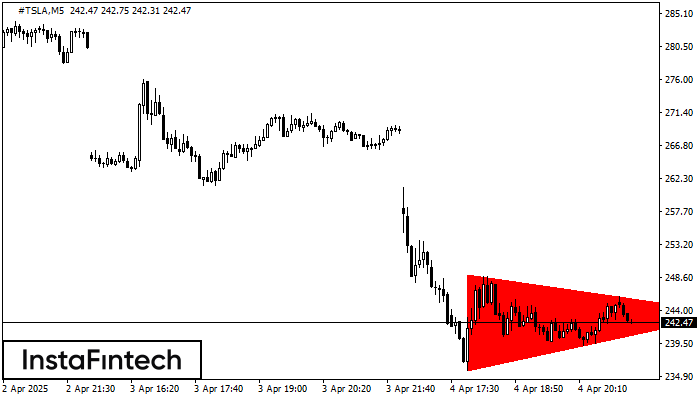
According to the chart of M5, #TSLA formed the Bearish Symmetrical Triangle pattern. Trading recommendations: A breach of the lower border 235.81 is likely to encourage a continuation of the downward trend.
The M5 and M15 time frames may have more false entry points.
আরও দেখুন
- All
- All
- Bearish Rectangle
- Bearish Symmetrical Triangle
- Bearish Symmetrical Triangle
- Bullish Rectangle
- Double Top
- Double Top
- Triple Bottom
- Triple Bottom
- Triple Top
- Triple Top
- All
- All
- Buy
- Sale
- All
- 1
- 2
- 3
- 4
- 5
ট্রিপল টপ
was formed on 01.06 at 02:15:04 (UTC+0)
signal strength 2 of 5

M15 চার্টে, #Bitcoin ট্রেডিং ইন্সট্রুমেন্টের ট্রিপল টপ প্যাটার্ন প্রবণতা পরিবর্তনের ইঙ্গিত দেয়। তৃতীয় পিকের গঠনের পরে, মূল্য 104215.56-এর রেজিস্ট্যান্স স্তর ভেদ করার প্রচেষ্টা চালানোর সম্ভাবনা রয়েছে, এক্ষেত্রে আমরা সেল করার
M5 এবং M15 টাইম ফ্রেমে আরও ভুল এন্ট্রি পয়েন্ট থাকতে পারে।
Open chart in a new window
ডাবল টপ
was formed on 01.06 at 01:00:35 (UTC+0)
signal strength 3 of 5

M30 চার্টে, #Bitcoin-এর ডাবল টপ রিভার্সাল বা বিপরীতমুখী প্যাটার্ন গঠিত হয়েছে। বৈশিষ্ট্য: উপরের সীমানা 104800.13; নীচের সীমানা 104215.56; প্যাটার্নের প্রস্থ হল 64024 পয়েন্ট। 104215.56 104215.30 স্তরের দিকে সম্ভাব্য মুভমেন্টের সাথে
Open chart in a new window
বুলিশ রেক্ট্যাঙ্গেল
was formed on 31.05 at 19:15:46 (UTC+0)
signal strength 1 of 5

M5 চার্ট অনুসারে, #Bitcoin বুলিশ রেক্ট্যাঙ্গেল গঠন করেছে যা চলমান প্রবণতার ধারাবাহিকতার প্যাটার্ন। প্যাটার্নটি নিম্নলিখিত সীমানার মধ্যে রয়েছে: নীচের সীমানা 104335.43 – 104335.43 এবং উপরের সীমানা 104800.13 – 104800.13৷ উপরের
M5 এবং M15 টাইম ফ্রেমে আরও ভুল এন্ট্রি পয়েন্ট থাকতে পারে।
Open chart in a new window


