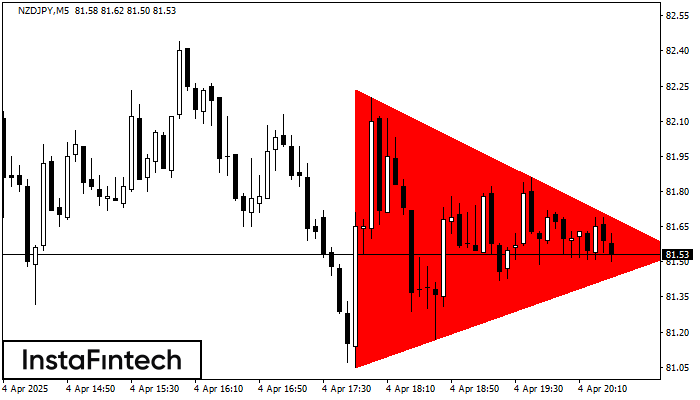
Bearish Symmetrical Triangle
was formed on 04.04 at 19:31:40 (UTC+0)
signal strength 1 of 5

According to the chart of M5, NZDJPY formed the Bearish Symmetrical Triangle pattern. This pattern signals a further downward trend in case the lower border 81.05 is breached. Here, a hypothetical profit will equal the width of the available pattern that is -118 pips.
The M5 and M15 time frames may have more false entry points.
- All
- All
- Bearish Rectangle
- Bearish Symmetrical Triangle
- Bearish Symmetrical Triangle
- Bullish Rectangle
- Double Top
- Double Top
- Triple Bottom
- Triple Bottom
- Triple Top
- Triple Top
- All
- All
- Buy
- Sale
- All
- 1
- 2
- 3
- 4
- 5
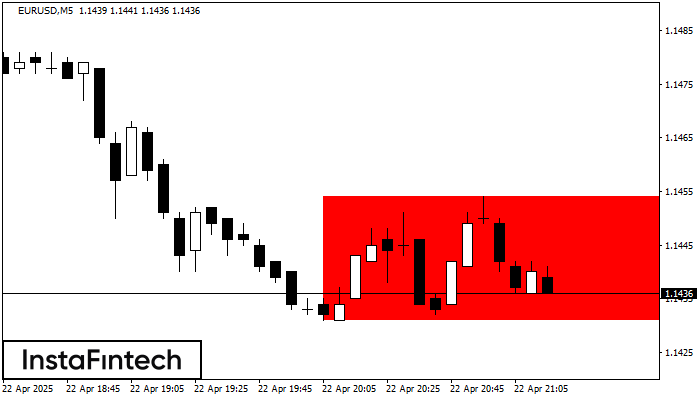
বিয়ারিশ রেক্ট্যাঙ্গেল
was formed on 22.04 at 20:19:28 (UTC+0)
signal strength 1 of 5
M5 চার্ট অনুযায়ী, EURUSD বিয়ারিশ রেক্ট্যাঙ্গেল গঠন করেছে। এই প্যাটার্ন চলমান প্রবণতার ধারাবাহিকতা নির্দেশ করে। উপরের সীমানা হল 1.1454, নীচের সীমানা হল 1.1431৷ এই সংকেতের অর্থ হল বিয়ারিশ রেক্ট্যাঙ্গেল-এর নীচের
M5 এবং M15 টাইম ফ্রেমে আরও ভুল এন্ট্রি পয়েন্ট থাকতে পারে।
Open chart in a new window
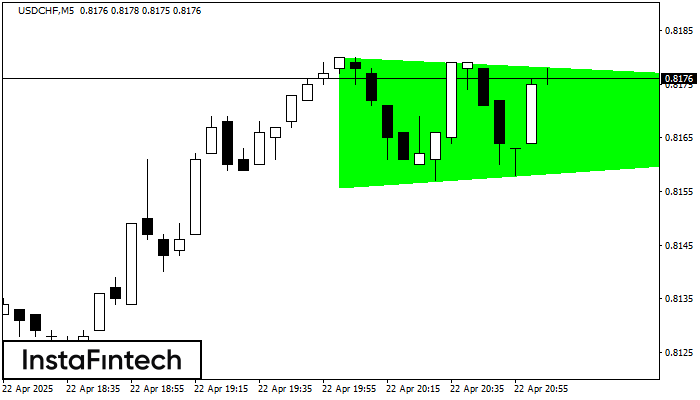
বুলিশ সিমেট্রিকাল ট্রায়াঙ্গেল
was formed on 22.04 at 20:06:01 (UTC+0)
signal strength 1 of 5
M5 চার্ট অনুসারে, USDCHF বুলিশ সিমেট্রিকাল ট্রায়াঙ্গেল প্যাটার্ন গঠন করেছে, যা চলমান প্রবণতা অব্যাহত থাকবে বলে ইঙ্গিত দিচ্ছে। বর্ণনা: প্যাটার্নের উপরের সীমানা 0.8180/0.8170-এর কোঅর্ডিনেটগুলো স্পর্শ করেছে যেখানে নীচের সীমানা 0.8156/0.8170
M5 এবং M15 টাইম ফ্রেমে আরও ভুল এন্ট্রি পয়েন্ট থাকতে পারে।
Open chart in a new window
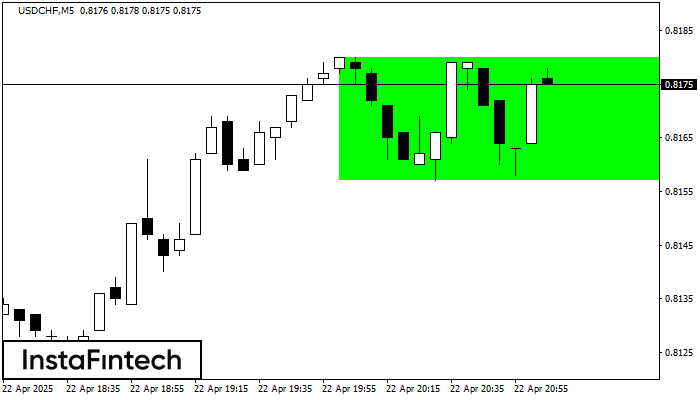
বুলিশ রেক্ট্যাঙ্গেল
was formed on 22.04 at 20:05:56 (UTC+0)
signal strength 1 of 5
M5 চার্ট অনুসারে, USDCHF বুলিশ রেক্ট্যাঙ্গেল গঠন করেছে যা চলমান প্রবণতার ধারাবাহিকতার প্যাটার্ন। প্যাটার্নটি নিম্নলিখিত সীমানার মধ্যে রয়েছে: নীচের সীমানা 0.8157 – 0.8157 এবং উপরের সীমানা 0.8180 – 0.8180৷ উপরের
M5 এবং M15 টাইম ফ্রেমে আরও ভুল এন্ট্রি পয়েন্ট থাকতে পারে।
Open chart in a new window


