

অ্যাকচুয়াল প্যাটার্নস

প্যাটার্ন হলো গ্রাফিক্যাল মডেল, যা মূল্য ওঠানামার ভিত্তিতে চার্টে তৈরি হয়। টেকনিক্যাল বিশ্লেষণের নীতি অনুযায়ী, ইতিহাসের (প্রাইস মুভমেন্ট) পুনরাবৃত্তি ঘটে। অর্থাৎ, পরিস্থিতি যদি একই রকম থাকে তাহলে প্রাইস মুভমেন্টও প্রায় একই রকম হয়। এর ফলে মূল্যের ওঠানামা কেমন হবে তা আগেই থেকেই অনুমান করা যায়।
ইন্সটাফরেক্স এর প্রাসঙ্গিক প্যাটার্নসমূহ সহজেই ব্যবহার করা যায়, যার মাধ্যমে মার্কেটের সর্বশেষ পরিস্থিতি জানা যায় এবং তার উপর ভিত্তি করে সিদ্ধান্ত নেওয়া যায়। আমাদের সেবাগুলো থেকে আপনি যেকোনো পেয়ার এবং টাইমফ্রেমের জন্য সর্বশেষ এবং সবচেয়ে প্রাসঙ্গিক প্যাটার্নগুলো খুঁজে পাবেন।
Inverse Head and Shoulder
was formed on 04.04 at 09:30:33 (UTC+0)
signal strength 1 of 5
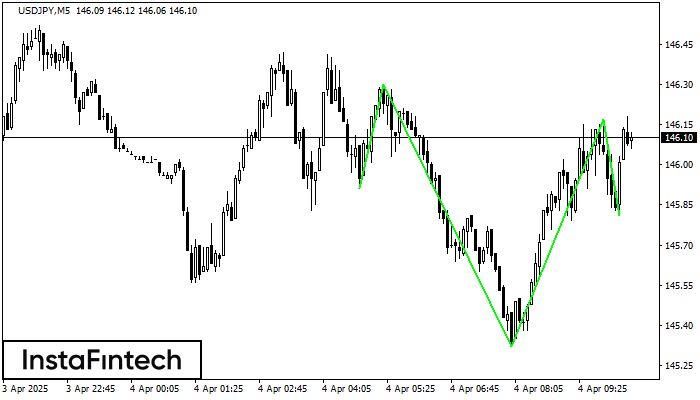
According to M5, USDJPY is shaping the technical pattern – the Inverse Head and Shoulder. In case the Neckline 146.30/146.17 is broken out, the instrument is likely to move toward 146.32.
The M5 and M15 time frames may have more false entry points.
- All
- All
- Bearish Rectangle
- Bearish Symmetrical Triangle
- Bearish Symmetrical Triangle
- Bullish Rectangle
- Double Top
- Double Top
- Triple Bottom
- Triple Bottom
- Triple Top
- Triple Top
- All
- All
- Buy
- Sale
- All
- 1
- 2
- 3
- 4
- 5
Double Top
was formed on 06.06 at 06:06:16 (UTC+0)
signal strength 1 of 5
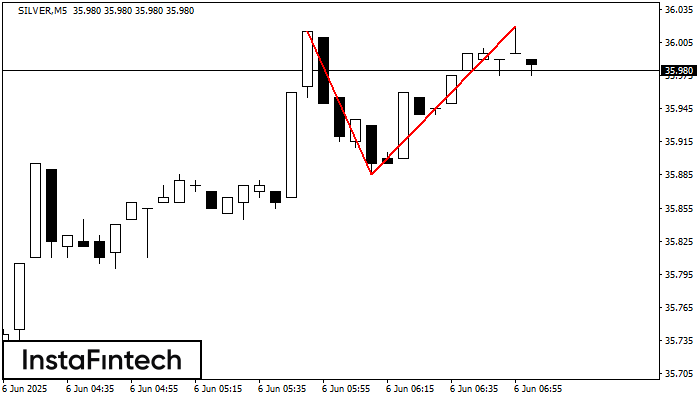
The Double Top pattern has been formed on SILVER M5. It signals that the trend has been changed from upwards to downwards. Probably, if the base of the pattern 35.88
The M5 and M15 time frames may have more false entry points.
Open chart in a new window
Bullish Symmetrical Triangle
was formed on 06.06 at 05:43:54 (UTC+0)
signal strength 2 of 5
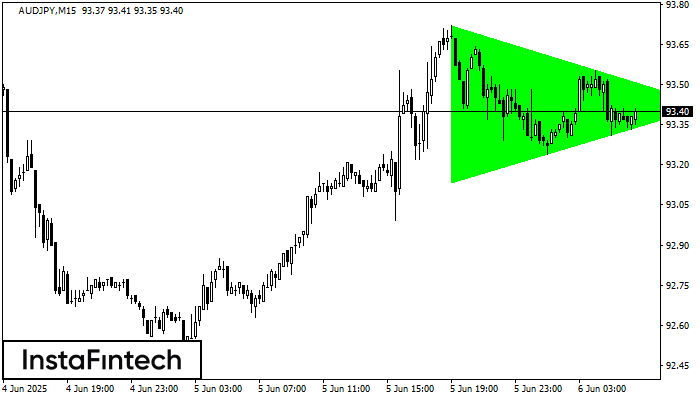
According to the chart of M15, AUDJPY formed the Bullish Symmetrical Triangle pattern, which signals the trend will continue. Description. The upper border of the pattern touches the coordinates 93.72/93.42
The M5 and M15 time frames may have more false entry points.
Open chart in a new window
Bearish Rectangle
was formed on 06.06 at 05:41:54 (UTC+0)
signal strength 1 of 5
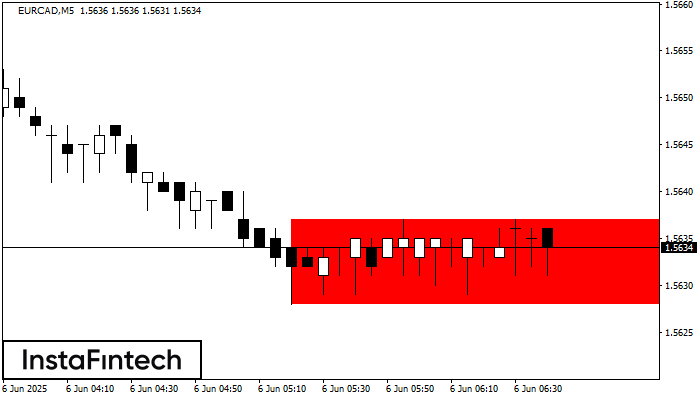
According to the chart of M5, EURCAD formed the Bearish Rectangle. This type of a pattern indicates a trend continuation. It consists of two levels: resistance 1.5637 - 0.0000
The M5 and M15 time frames may have more false entry points.
Open chart in a new window


