

অ্যাকচুয়াল প্যাটার্নস

প্যাটার্ন হলো গ্রাফিক্যাল মডেল, যা মূল্য ওঠানামার ভিত্তিতে চার্টে তৈরি হয়। টেকনিক্যাল বিশ্লেষণের নীতি অনুযায়ী, ইতিহাসের (প্রাইস মুভমেন্ট) পুনরাবৃত্তি ঘটে। অর্থাৎ, পরিস্থিতি যদি একই রকম থাকে তাহলে প্রাইস মুভমেন্টও প্রায় একই রকম হয়। এর ফলে মূল্যের ওঠানামা কেমন হবে তা আগেই থেকেই অনুমান করা যায়।
ইন্সটাফরেক্স এর প্রাসঙ্গিক প্যাটার্নসমূহ সহজেই ব্যবহার করা যায়, যার মাধ্যমে মার্কেটের সর্বশেষ পরিস্থিতি জানা যায় এবং তার উপর ভিত্তি করে সিদ্ধান্ত নেওয়া যায়। আমাদের সেবাগুলো থেকে আপনি যেকোনো পেয়ার এবং টাইমফ্রেমের জন্য সর্বশেষ এবং সবচেয়ে প্রাসঙ্গিক প্যাটার্নগুলো খুঁজে পাবেন।
Bearish Rectangle
was formed on 03.04 at 21:49:49 (UTC+0)
signal strength 2 of 5
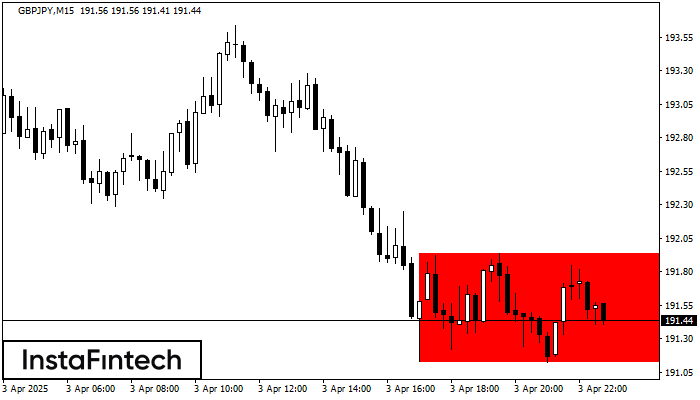
According to the chart of M15, GBPJPY formed the Bearish Rectangle. This type of a pattern indicates a trend continuation. It consists of two levels: resistance 191.94 - 0.00 and support 191.12 – 191.12. In case the resistance level 191.12 - 191.12 is broken, the instrument is likely to follow the bearish trend.
The M5 and M15 time frames may have more false entry points.
- All
- All
- Bearish Rectangle
- Bearish Symmetrical Triangle
- Bearish Symmetrical Triangle
- Bullish Rectangle
- Double Top
- Double Top
- Triple Bottom
- Triple Bottom
- Triple Top
- Triple Top
- All
- All
- Buy
- Sale
- All
- 1
- 2
- 3
- 4
- 5
รูปแบบกราฟหัวและหัวไหล่แบบกลับหัว (Inverse Head and Shoulder)
was formed on 24.04 at 00:10:29 (UTC+0)
signal strength 1 of 5
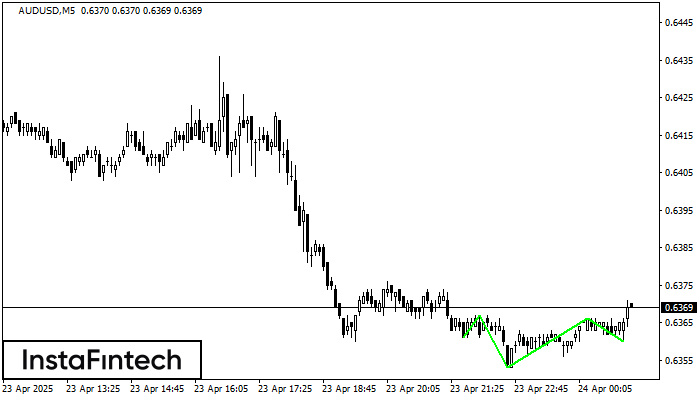
อ้างอิงจากชาร์ตของ M5, AUDUSD ที่ได้สร้างรูปแบบ รูปแบบกราฟหัวและหัวไหล่แบบกลับหัว (Inverse Head and Shoulder) ออกมา ระดับสูงสุดของตำแหน่งหัวอยู่ที่ 0.6366 ในขณะที่เส้นระดับกลางของแนวคอ จะอยู่ที่ 0.6353/0.6360
ขอบเตระยะเวลาใน M5 และ M15 อาจจะมีตำแหน่งการเข้าใช้งานที่ผิดพลาดมากยิ่งขึ้น
Open chart in a new window
รูปแบบกราฟหัวและหัวไหล่ (Head and Shoulders)
was formed on 24.04 at 00:10:29 (UTC+0)
signal strength 1 of 5
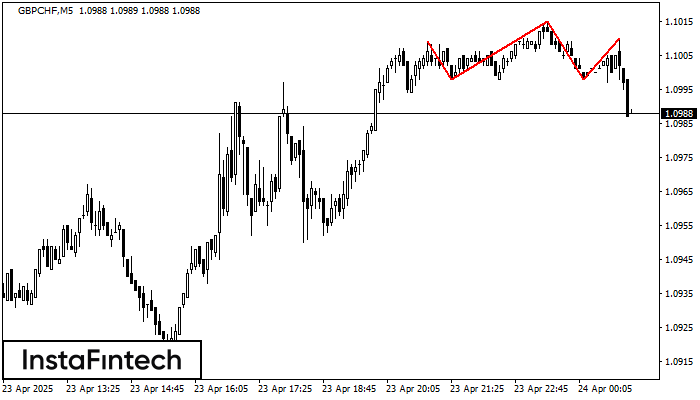
อ้างอิงจากชาร์ตของ M5, GBPCHF ที่ได้สร้างรูปแบบ รูปแบบกราฟหัวและหัวไหล่ (Head and Shoulders) ออกมา สำหรับระดับสูงสุดของตำแหน่งหัวอยู่ใน 1.1015 ขณะที่เส้นระดับกลางของตำแหน่งคอจะอยู่ใน 1.0998/1.0998 การก่อตัวของรูปแบบ รูปแบบกราฟหัวและหัวไหล่
ขอบเตระยะเวลาใน M5 และ M15 อาจจะมีตำแหน่งการเข้าใช้งานที่ผิดพลาดมากยิ่งขึ้น
Open chart in a new window
รูปแบบกราฟจุดสองยอด (Double Top)
was formed on 24.04 at 00:00:37 (UTC+0)
signal strength 3 of 5
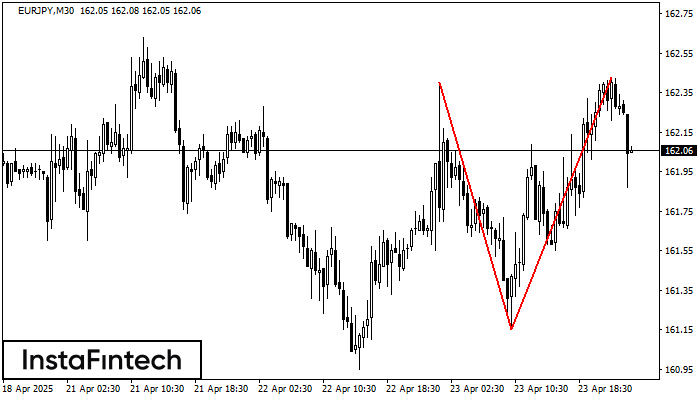
รูปแบบการย้อนตัว รูปแบบกราฟจุดสองยอด (Double Top) ได้ถูกสร้างขึ้นมาใน EURJPY M30 คุณลักษณะ: ขอบเขตด้านบน 162.40; ขอบเขตด้านล่าง 161.15; ความกว้างของกราฟรูปแบบนี้คือ 128 จุด
Open chart in a new window


